Table of Contents
1
Overview of SurveyManager 8
1.1
Setting up Your Survey.
8
1.1.1
Use the QDP library of questionnaires.
8
1.1.2
Copy forward last year’s Survey.
8
1.1.3
Build new questionnaires.
8
1.1.4
Targeting your questionnaires.
8
1.1.5
How will your survey be completed.
8
1.2
Reports.
8
1.3
Getting Further Help.
9
1.4
Conventions Used In This Manual 9
1.5
How SurveyManager Operates.
10
2
Login Screen.
11
3
Home Page.
12
3.1
My Surveys.
12
3.2
Users.
13
3.3
Group Administration.
15
3.4
Profile.
17
3.4.1
Customer Details.
18
3.4.2
User Settings.
18
3.4.3
Visual Defaults.
19
3.4.4
Organisational Structure.
19
4
Creating a New Survey.
21
4.1
Creating a Survey Afresh.
21
4.1.1
Project Plan.
21
4.1.2
Granting Access to a Survey Project 23
4.2
Copy an Existing Survey.
24
5
Questionnaires.
26
5.1
Creating New Questionnaires.
26
5.2
Cloning a Questionnaire.
27
5.3
Settings.
27
5.3.1
Web.
28
5.3.2
Printing.
28
5.3.3
Paired Questionnaires.
28
5.4
Previews (Paper/Web) 29
5.5
Import 29
5.6
Delete.
29
5.7
Save.
30
5.8
Sections.
30
5.8.1
Renaming/Deleting a Section.
31
5.8.2
Changing the response scale for a Section.
31
5.8.3
Adding a New Section.
32
5.8.4
Adding a QDP Section.
33
5.9
Adding/Editing Questions.
35
5.9.1
Rated Statement Questions.
35
5.9.2
Multiple Choice (One Answer Only) Questions.
37
5.9.3
Multiple Choice (Multiple Answer) Questions.
38
5.9.4
Free Text Questions.
38
5.9.5
Changing the Order 39
5.10
Adding QDP Questions.
39
5.11
Deleting Questions.
40
5.12
Adding/Editing/Deleting Text 40
5.13
Using “My Library Questions”.
41
5.13.1
Add a question to My Library.
41
5.13.2
Using a question from My Library.
42
6
Targets.
43
6.1
Open Blank Target List Model 43
6.2
Add New Target List 44
6.3
Exporting/Deleting Target Lists.
47
6.4
Changing Target Lists.
48
6.5
Adding Additional Targets to a Survey.
49
6.6
Subject Specific Targeting.
49
7
Publishing and Distributing the Survey.
51
7.1
Publishing the Survey.
51
7.2
Additional Charges.
54
7.3
Distributing the Survey.
55
7.3.1
Download.
56
7.3.2
Print 57
7.4
Manual Input 58
7.5
Monitoring Returns.
59
7.6
Report 60
7.7
Pausing a Published Survey.
61
7.8
Archiving a Survey.
61
8
The Reports Browser 62
8.1
CD Tree Structure Panel 64
8.2
Reports Tab.
66
8.2.1
Report Style Selection.
66
8.2.2
Preview..
66
8.2.3
Report Sheets Available.
66
8.3
Search Tab.
67
8.4
Help Panel 68
9
Combined Graphical Report 69
9.1
Report Sheet 71
9.1.1
Headings.
71
9.1.2
Questions.
71
9.1.3
Graph.
71
9.1.4
Data.
72
9.1.5
Calculated Numbers.
72
9.2
Demographics Sheet 76
9.2.1
Headings.
76
9.2.2
Questions.
76
9.2.3
Data.
76
9.3
Questionnaire Stats Sheet 78
9.4
Questionnaire Usage Sheet 80
9.4.1
Headings.
80
9.4.2
Questions.
80
9.4.3
Questionnaires.
80
9.4.4
Matrix ID..
80
10
Summary Report 81
10.1
Response Rate.
82
10.2
Results Summary.
84
10.3
Strengths and Weaknesses.
86
10.4
Improvements and Concerns.
88
11
Internal Benchmarking Report 89
11.1
Headings.
91
11.2
Questions.
91
11.3
Benchmark.
91
11.4
Cohorts.
91
12
League Table Report 93
12.1
Headings.
95
12.2
Cohorts included.
95
12.3
Ranked by.
95
12.4
The Data.
95
12.5
Mean Rating.
96
13
Distance Travelled Report 97
13.1
Headings.
99
13.2
Surveys Used.
99
13.3
Questions.
99
13.4
Distance Travelled.
99
14
Issue Comparison Report 100
14.1
Headings.
102
14.2
Cohorts.
102
14.2.1
Graph.
102
14.2.2
Calculated Numbers.
102
15
Marketing Summary Report, Bar and Pie Charts.
104
15.1
Marketing Summary.
106
15.1.1
Main Report Headings.
106
15.1.2
Chart Headings.
106
15.1.3
Data.
106
15.2
The Chart 106
15.3
Bar Chart 108
15.3.1
Headings.
108
15.3.2
Data.
108
15.4
The Chart 108
15.5
Pie Chart 110
15.5.1
Headings.
110
15.5.2
Data.
110
15.6
The Chart 110
16
Employer Survey Reports.
111
16.1
Response Report 113
16.1.1
Headings.
113
16.1.2
Data.
113
16.2
Response Matrix Report 115
16.2.1
Headings.
115
16.2.2
Data.
115
16.2.3
Matrix.
115
16.3
Recommendation Report 118
16.3.1
Headings.
118
16.3.2
Data.
118
16.3.3
Graph.
118
16.3.4
Calculated Data.
118
17
Additional Reports Available.
121
17.1
Management Summary Report 121
17.1.1
Returns and Overall Satisfaction.
122
17.1.2
Overall performance of the level of the organisation.
124
17.1.3
Performance of the level of the organisation by statement
126
17.1.4
Demographic Performance.
128
17.1.5
Comparison against National Respondents.
130
17.1.6
Comparison against National Providers.
132
17.1.7
Distance Travelled.
134
17.2
Graphical Report 135
17.2.1
Report Sheet 137
17.2.2
Demographics Sheet 141
17.3
Graphical with External Benchmarking Report 142
17.3.1
Report Sheet 144
17.3.2
Demographics Sheet 149
17.3.3
Other Questions Sheet 149
17.3.4
Contributors Sheet 151
17.3.5
Raw Data Sheet 153
17.3.6
Questionnaire Usage Sheet 155
17.3.7
Questionnaire Stats Sheet 157
18
All Returns Report 158
18.1
Report Sheet 160
18.1.1
Headings.
160
18.1.2
Data.
160
19
Glossary of Terms.
161
19.1
Agree Percentage.
161
19.2
Benchmark.
161
19.3
Difference From..
161
19.4
Difference.
161
19.5
Distance Travelled Report 162
19.6
External Benchmark.
162
19.7
External Benchmarking Report 163
19.8
Filtered By.
163
19.9
Flattened Total 163
19.10
Graphical Report 163
19.11
Internal Benchmark.
164
19.12
Internal Benchmark Report 164
19.13
Mean Rating.
164
19.14
Not Answered.
164
19.15
Percentage of Sample.
164
19.16
Period.
165
19.17
Provider Criteria.
165
19.18
Questionnaire Type.
165
19.19
Ranked By.
165
19.20
Rating.
165
19.21
Report By.
166
19.22
Report Style.
166
19.23
Respondents.
167
19.24
Return.
167
19.25
Return Count 167
19.26
Summary Rating.
167
19.27
Targeted.
167
19.28
Yield.
168
20
Interpretation.
169
21
Compliance with data protection laws.
170
22
Use, disclosure and publication.
170
23
Purpose.
170
24
Personal data.
170
25
Fair and lawful processing.
171
26
Data subjects' rights.
171
27
Data retention and deletion.
172
28
Third party access and international transfers.
172
29
Security and training.
172
30
Freedom of information.
173
31
Data security breaches and reporting procedures.
173
32
Resolution of disputes with data subjects or the Data Protection
Authority.
173
33
Third party rights.
174
34
Severance.
174
35
Changes to the applicable law..
174
36
No partnership or agency.
174
37
Entire agreement 174
38
Rights and remedies.
174
39
Notice.
174
40
Governing law..
175
QDP’s
Survey Manager.
177
Terms of
Use.
177
GENERAL.
177
1. Legal
Status.
177
2. Licences
and Payment.
177
3.
Additional Fees and Payment.
178
If Customer
purchases additional services, for example printing of
questionnaires or undertaking of phone calls by QDP (“Additions”),
Customer shall pay for these Additions as well as VAT and any other
applicable taxes, as published in QDP Price Guide and available on
QDP’s Survey Manager and as agreed with QDP at the time of
purchase. 178
4. QDP
Materials.
178
5. Customer
Content.
178
6. Customer
Conduct.
179
7.
Indemnity by Customer.
181
8.
Termination.
181
9.
Provision of QDP’s Survey Manager.
182
10.
LIMITATIONS AND EXCLUSIONS OF QDP'S LIABILITY.
183
11.
Intellectual Property Rights.
184
12. Privacy
Policy.
185
13.
General 185
Survey Manager is an online software package
designed to put you back at the heart of your feedback projects. We
have created a unique product that allows you to design, build and
publish questionnaires online or in paper format, receive
real-time, online reports whilst still retaining all the support
and guidance that QDP has provided for nearly 20 years.
You can use a QDP library model as a template
or build your own bespoke questionnaires from scratch, copy last
year’s survey forward or build your questionnaire from the QDP bank
of pre- loaded questions. QDP will still help and guide you
throughout your survey project and are always there to provide the
reassurance a trained quality team gives.
- All questionnaire models available to use or
modify
- Add or remove questions as you wish
- QDP will update all the questionnaire models
each year making sure you address all the current issues in the
education and skills sector
- Use last year’s survey as a template for the
current year
- Link surveys to get your distance travelled
reporting
- Create your own questionnaires
- Create your own questions
- Design ad hoc surveys and save them in your
Survey Manager library so you can use them again
- Multiple questionnaires can be created within
a single survey project
- Who completes the questionnaires, how they
are given access to it and which questionnaire within the survey
project they are given access is controlled by your target
list
- The target list also contains the structure
that you are going to report under
- Small ad-hoc surveys can contain a single
line target list
Online Surveys are accessed via an emailed
link or by logging onto the secure QDP web server. Paper surveys
are printed and distributed by QDP, or printed and distributed by
you. For telephone surveys, QDP runs an in-house telephone unit to
make all your calls for you.
- Detailed reporting from QDP
- Reports structure to match your
organisation
- Real time All Returns to help improve
response rates
- Full report set generated on demand
- Comprehensive External Benchmarking
- Reports available on the web in Survey
Manager
- Reports CD and paper copies are
available
We recommend working through this guide in
conjunction with the SurveyManager software and setting up a “play”
survey to familiarise yourself with the interaction style and in
particular understand how the organisational structure maps onto
entries in the target list and ultimately the report structure
before creating live surveys. This will help you plan your approach
to the creation of surveys.
If you require further help with any aspect of
SurveyManager’s operation, please call the QDP’s Customer Services
team on 01625 501917. Alternatively, you can chat live online by
clicking the link on the front page of the QDP Services web
site.
Throughout this manual we use the term
“button” to refer to both on-screen buttons and links.
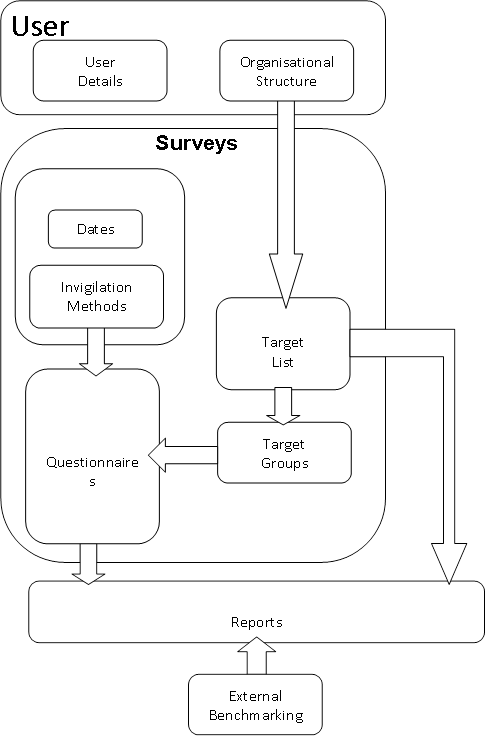
The following diagram shows how the different
components of SurveyManager fit together. As you read this manual,
refer back to this diagram.
Whenever you access the SurveyManager web
site, you should see the following login screen.
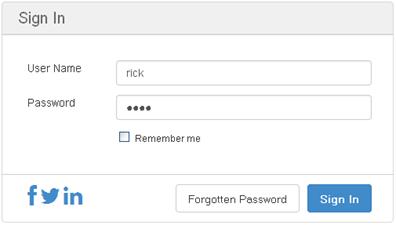
If you are using a shared computer DO
NOT click the tick box marked “Remember me”. This will remember
your credentials and will allow anyone to log into SurveyManager
under your account without explicitly knowing your password. If you
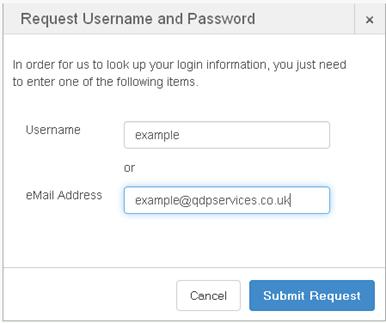
forget your username or password, click “Forgotten Password?” and
enter your username or email address. Your credentials will be
mailed to you…
On logging in, you’ll be presented with the My
Surveys page. This is the “home” page, and forms a dashboard
that allows you to access and administer your surveys, as well as
administrating user accounts and groups.
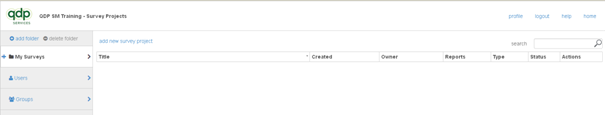
To the left are three tabs:
·
My Surveys – which enables you to view the survey projects you have
created. The surveys can be stored within a folder structure which
you can create and maintain using the buttons above the tabs on the
left of the screen. See below…
·
Users - which allows you to add new users to SurveyManager.
·
Groups – defines the groups to which the users belong.
Above these tabs are two buttons which allow
you to create and maintain a folder structure to help organise your
survey projects. The structure can be up to 3 folders
deep.

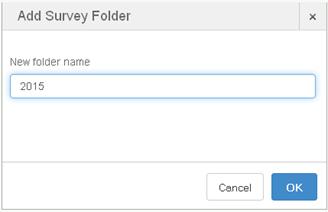
To add a new folder click the add button and
type the new folder name and click OK. The folder will be added at
the current level.
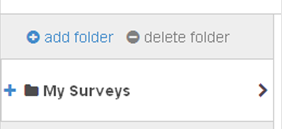 A plus sign to the left of the
My Surveys tab indicates there are sub-folders. Click the
plus to reveal the next level of the structure.
A plus sign to the left of the
My Surveys tab indicates there are sub-folders. Click the
plus to reveal the next level of the structure.
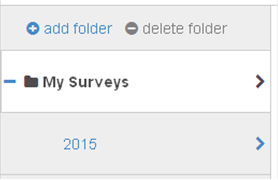 The minus will collapse the
structure,
The minus will collapse the
structure,
Once you are in a lower level folder the
delete folder tab will become enabled. A folder can be
deleted once it is empty.
At the top right of the home page
there are four links…

The profile link enables you to change your
user details (address, password, etc.) and to define an
organisational structure against which you can organise groups of
targets. Always remember to click logout when you are finished
using SurveyManager.
To return to this page at any time, on any
other page click the “home” link at its top right…
Clicking on the Users tab on the home page
displays a list of the currently defined users.
To add a new user:
- Click “add new user” at the top left of the
main panel. This produces the following pop up window…
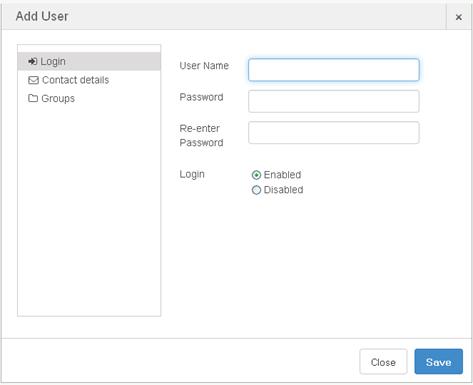
- Enter a suitable user name and a password to
continue. Please note that the user name and password are case
sensitive.
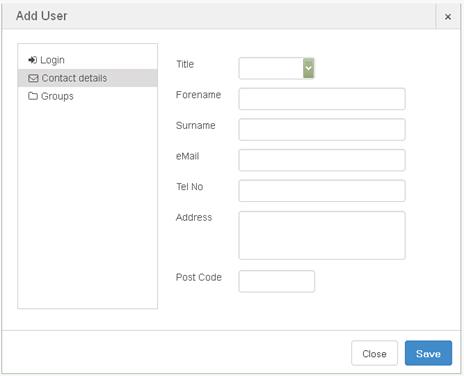
- The Contact Details section allows you to
enter the user’s real name and title, phone number and postal
details…
- Finally, the “groups” tab allows you to add
the user to a group for management purposes (further information
about this is highlighted in section Group Administration)
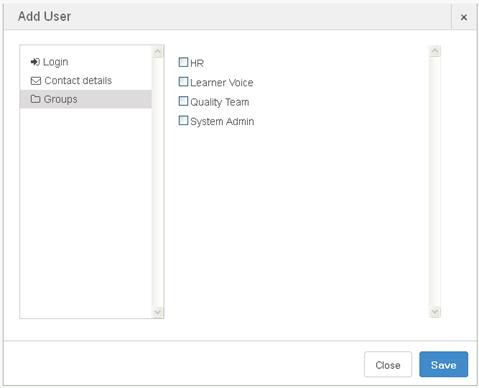
- Click Save to complete adding the user.
- You can delete a user by clicking the
relevant “delete” button in the Users Tab. This is an important
housekeeping measure that should be carried out when users leave or
no longer need access to SurveyManager.
- You can also click “Edit” to edit the user’s
details, in which case the same windows as above are
displayed.
SurveyManager allows you to create new users
and assign them to particular groups to reflect, for example, the
departmental structure of your organisation. Once created a
particular group are able to operate on the set of questionnaires
created by the members of the group.
The level of access can be further controlled
by the kind of group that a user belongs to. There are two kinds of
groups: admin and guest.
- Members of admin groups can create
other users and groups, surveys and questionnaires.
- Guest members can only add questions
to their own questionnaires.
The creator and therefore owner of a
particular survey can grant groups access to their survey
project. If they grant guest access they cannot modify the
questionnaire, target list or request reports.
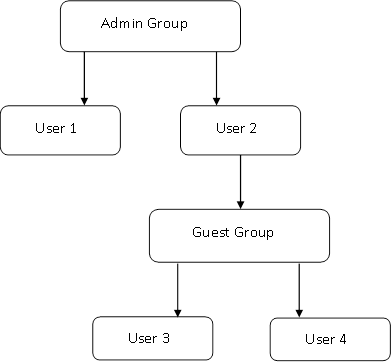
In the diagram above, the admin group consists
of Users 1 and 2. User 2 has created a guest group containing Users
3 and 4. Groups are good for organising your users, and can mirror
the physical departments in your organisation structure.
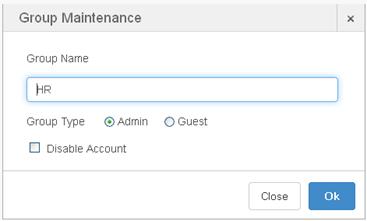
To create a new group:
- Click the Groups tab and then “add new
group”. The following window pops up.
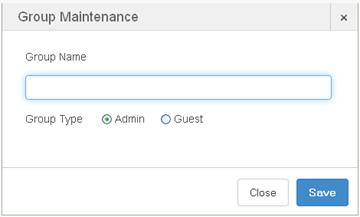
- Enter a name for the group and choose whether
it is to have administration rights, then click “Save”. The new
group appears on the home page’s Groups tab.
- To delete the group, click Delete and confirm
the deletion.
Members of a guest group only have the right
to view the results of a completed survey.
You can also change the name, disable or
change the type of a group at any time by clicking “edit”…
Members of admin groups can administer other
users and create groups.
The profile is where you enter your contact
details and logo, change your own username and password and where
you create a logical structure for your survey projects, onto which
you will later map groups of targets for individual questionnaires.
This page is accessed from the home page and contains four tabs, as
follows…
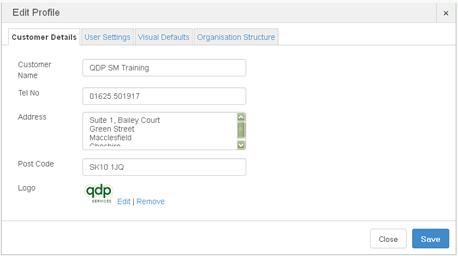
This tab is where you enter your name,
address, telephone number and postcode.
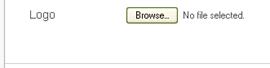
In addition you can change or remove the logo
which will appear on your questionnaires and reports. To
change the logo, click the “Edit” button. The bottom section
of the screen will change to allow you to search and load a new
logo from your computer. Please note, the logo needs to be
correctly sized to the dimensions required for appearance on your
questionnaires and reports; your Customer Services contact at QDP
can assist you with this if you are unsure.
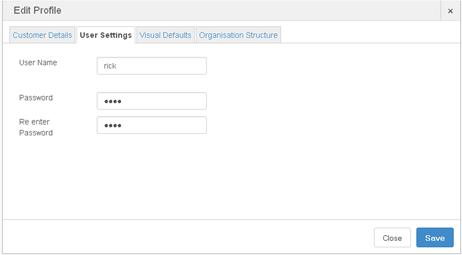
The user settings tab allows you to change
your user name and your password. It is recommended that you change
your password on a regular basis to prevent security breaches.
The Visual Defaults tab is provided for future
development.
The organisational structure tab provides help
when loading target lists. See section ‘Targets’. The
validation of target list will check that the elements included
within the organisation structure have been included as columns
within the target list. For example you may want to ensure
that Department, Course and Section are always included within a
Learner target list.
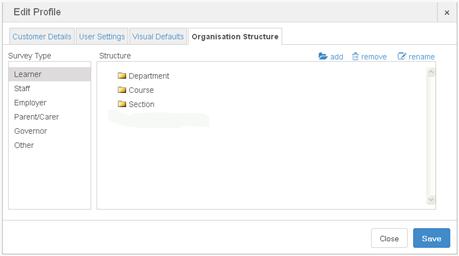
- On the left is the list of the standard
survey types. Select a type (we’ve selected Learner in the figure
above)
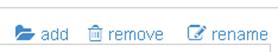
- You can add an organisational element to the
type by clicking the link on the top left.
- You can remove or rename elements by clicking
on the appropriate entry and then the required link, either remove
or rename.
As an example, for the Learner category, we’ll
create organisational elements of Course, Section and Department.
When we come to define targets SurveyManager will warn if these
columns have not been included in the target list. This has
two important benefits:
·
If you, or QDP, are printing questionnaires all the relevant
distribution information will be available
·
More important, when we come to create the reports all the
organisational elements that need to be reported can be.
Columns cannot be added to target lists after the survey project is
published and it is therefore vital to ensure all the elements you
require in your reports are included in the target list.
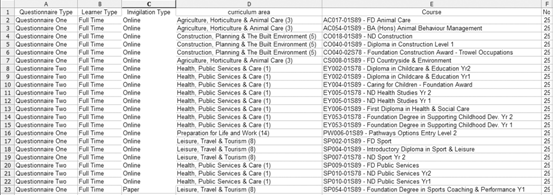
As you can see, the curriculum area and course
enable you (or QDP if you opt for us to print or invigilate the
questionnaires) to define what groups of targets are to fill out
which questionnaires. Each row represents a group of targets.
To express that courses are subordinate within
a curriculum area (as we’ve done above and shown by course being
indented underneath curriculum area), you can either select the
curriculum area you just defined and then click the folder icon to
add the course as its subordinate, or if you’ve already created the
course, drag and drop it onto the curriculum area.
Finally, click “Save” and then click “Close”
to continue.
There are two options for creating a new
survey:
- Creating a survey afresh.
- Copy an existing survey.
To create a new survey project:
- Ensure you are in the required folder for the
new survey.
- Click “add new survey project” on the top
left side of the main panel on the home page. This presents a list
of existing surveys which looks very similar to the home page. To
create a new one, click “create new blank project” again in the top
left hand corner of the main panel to bring up the survey’s Project
Plan page.
The project plan defines the survey type,
title and the key dates within your survey.
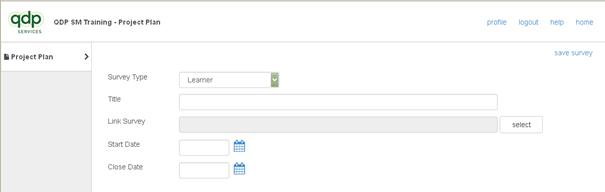
- Select the type of survey that you are
setting up; i.e. learner, staff, employer etc. This is very
important as it ensures that you have access to the correct example
questionnaires and matrix of questions when creating each
questionnaire within the survey project.
- Enter a name for the survey project. This is
the name that will appear in the list of surveys on the home page
and it should be unique to allow easy identification (usually by
adding the month and year to the survey title e.g. Student Feedback
– Induction - Oct 2015)
- The ‘Link Survey’ box allows you to link this
survey to a previous one for the purposes of Distance Travelled
reporting. To do so, click the “…” button at the right of the
entry. A window appears containing your previous surveys…
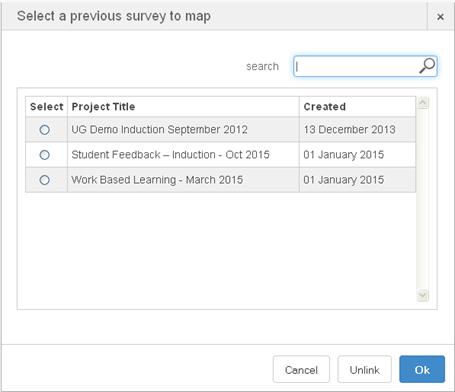
Select a survey to link with and click OK. You
can also unlink the current survey on this screen.
- Enter a proposed Start Date either by typing
it the box provided or by clicking the button to the right of the
box
- Enter a proposed End Date. The date are
only for your information they are not used to automatically start
or end surveys within SurveyManager
- When you’re done, click “save survey” on the
top right of the main panel to continue. An additional 4 tabs
will appear down the left hand side of the screen.
The survey project will now appear on your
home screen.

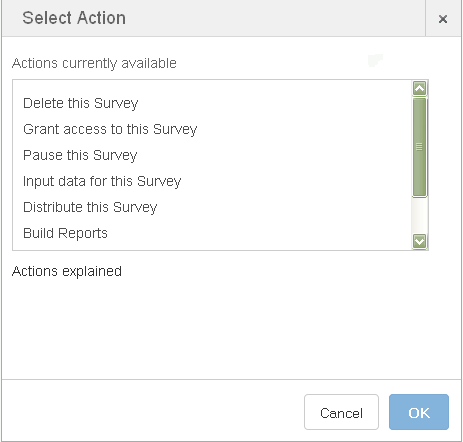
The status and actions available will change
as the survey project progresses. The actions can be viewed by
clicking the “view” link on the right of the screen next to the
appropriate survey project. A pop-up will display the current
actions available to choose from…
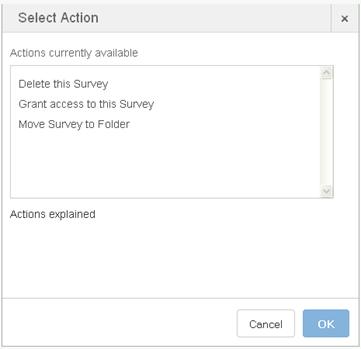
Clicking on an action will provide a detailed
explanation in the lower half of the screen.
When each
survey project is created only you and members of your group or
groups can see or amend the survey. If you wish to grant
other people access, follow the instruction inthe next section.
Once your survey project is set up, you can
grant user groups access to it (you will need to do this if you
want other SurveyManager users outside your groups to be able to
access the survey).
- On the home page, click the “view” Actions
link on the right against the appropriate survey.
- Select “Grant access to this Survey” from the
list and click OK. The following window pops up with a list of all
the groups that you have set up)…
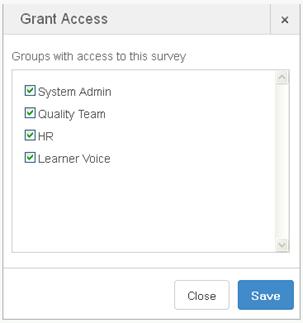
- Select the groups to whom you wish to grant
access to the project using the tick boxes, then click “Save” to
continue. You can remove access in the same way.
Copying an existing survey allows you to bring
forward previously used questionnaires, which can be kept
identical, or amended.
To copy an existing survey:
- Click “add new survey project” on the home
page. This presents a list of existing surveys.
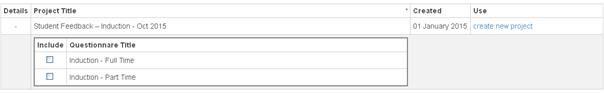
- Click on the “+” to the left of the survey
that you wish to copy over. This will open up a list of the
questionnaires included in the survey.
- Click in the check box next to the
questionnaires that you want to copy and then click “create new
project” on the right. This will open a Project Plan.
- Change the title of the survey to reflect the
new survey.
- The new survey will be automatically linked
to the one that you have copied over (you can change this using the
drop down arrow if required). The purpose of this is so that
Distance Travelled reports can be run.
Amend the
dates to reflect the survey dates and save the survey. The
questionnaires will now be saved in the new survey and ready to be
amended as you see fit (more information about this can be found in
section 5)
Once the project plan has been established,
you can begin populating your survey with one or more
questionnaires. Questionnaires consist of one or more logical
sections, each containing questions related to a specific subject.
You can also add explanatory text to a section and include page
breaks between sections.
To define a new questionnaire for a
survey:
- Firstly access the survey from the
SurveyManager homepage and once open, click on the ‘Questionnaires’
tab on the left. At the top of the questionnaire page is the
following action bar…
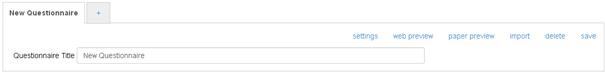
- A survey can contain multiple questionnaires,
with each having its own tab. In the image above, there are two,
called “Questionnaire 1” and “Questionnaire 2”. To select a
questionnaire, click its tab. To create a new questionnaire, click
the “+” tab.
- SurveyManager carries a library of predefined
questionnaire templates you can load. To view the library and to
use one of the templates as the basis for a new questionnaire,
right click one of the questionnaire tabs and select “Open
Questionnaire Template”.
- You can use the search box to help locate the
appropriate model. Type a few letters that should appear in
the questionnaire title. For example “prog” and press return.
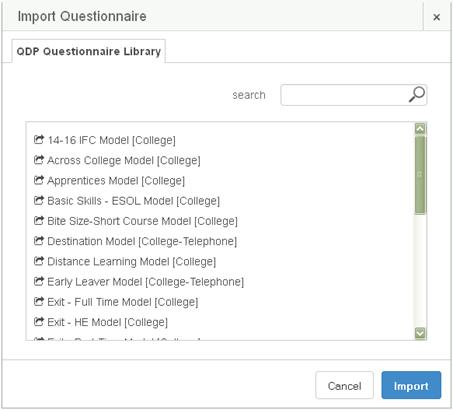
- The questionnaire templates shown will be
relevant to the survey project type you set on the Project Plan
page. Select a template and click “Continue”. The new questionnaire
is populated with questions from the template. Rename the
questionnaire if appropriate and save it.
Once you have created a questionnaire you can
make a copy or clone by right clicking on the appropriate
questionnaire tab and selecting Clone as New Questionnaire.
For example you may wish to create a
questionnaire for full time learners, which includes questions
about the experience including their induction and some of the
college. In the same survey project you may want to ask the
part time learners the majority of the question but exclude those
on the facilities. To do this create the full time
questionnaire and then clone it to create a copy for the part time
questionnaire. The part time version can then be amended to
exclude those questions not needed.
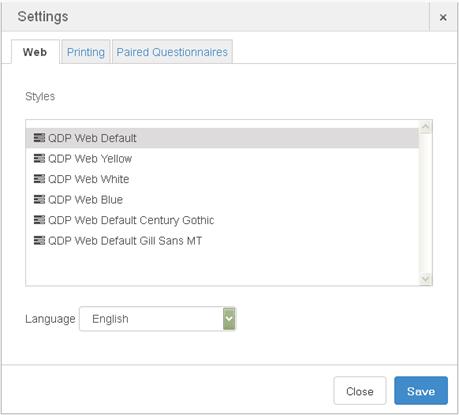
The settings apply to each questionnaire
within the survey project. There are three tabs within the
‘Settings’ section;
This allows you to dictate the background
colour of an online survey. There are some pre-set colours
available; however you can make a request to QDP to add an
additional colour if you require. At the foot of the pop-up there
is also a drop down box which allows you to determine the language
of the used when displaying the buttons, footer and key of the
questionnaire (English or Welsh).
Similarly the font and language can be changed
on printed questionnaire by selecting the appropriate choices from
the list.
This allows you to offer the target the choice
of questionnaire to answer. For example a Welsh college may want to
offer its targets the choice to answer a questionnaire in English
or in Welsh. The English and Welsh questionnaires are first created
within the survey project. To make the pairing, click in the check
box next to the questionnaire that you wish to pair the current
questionnaire with and click ‘Save’. Please note that this facility
only has an effect on online surveys and that you can only pair
questionnaires within the same survey.
As you add sections and questions to a
questionnaire, you can see how it will look on screen and in print
by clicking ‘Web Preview’ or ‘Print Preview’. The first option
opens a window showing how the online questionnaire will look to
the target. The latter opens a window giving a pdf preview of how
the questionnaire will appear on paper. This allows you to see if
you wish to make any formatting changes or add page breaks.
The import button allows you to import a full
questionnaire from the library in the same way as described in
section 5.1 Creating New Questionnaires.
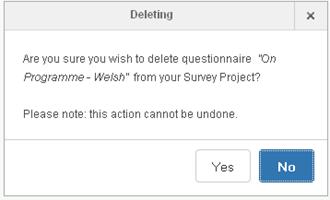
To delete the currently selected questionnaire
from the survey project, select Delete and confirm that you want to
delete it. Deleting a questionnaire will delete all the questions
and sections and any answers stored against them. Please note
that this action cannot be undone.
Save is provided to save any title changes to
the questionnaire. Questions and section are saved
automatically as they are created. You can save your work at any
time by clicking “save”.
By default, a newly created questionnaire
contains an initial empty section…
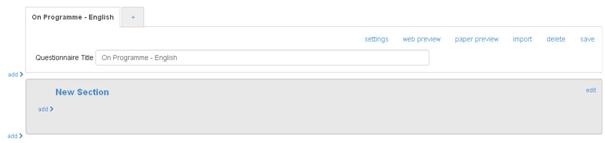
To the right and at the top of each section is
an option called Edit. Click this and the following menu of options
appears.

Once a
Rated question (see section 5.9.1) has been added into a section,
additional information concerning the response scale used for the
section will be displayed next to the Edit button.

Click the ‘Edit’ option on the above menu and
enter a new name.
To delete it, click Delete. Deleting a section
will permanently delete the section and all the questions within it
including any answers already stored against those questions.
To close this menu and continue, click the “X”
icon on the right.
Click the ‘Edit’ option on the above menu…
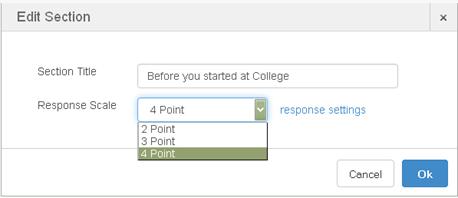
The number of points to be used can be chosen
and by clicking response settings the wording to be used can also
be changed. If you require a wording that does not appear
please contact QDP’s Customer Service Team.
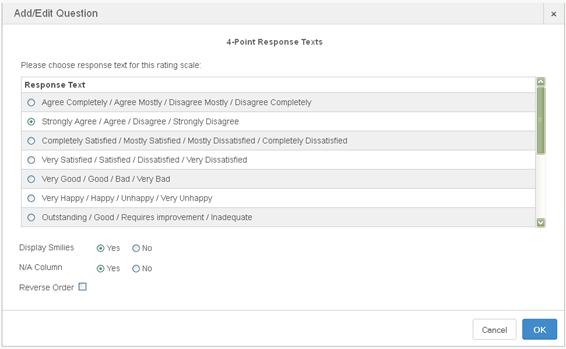
In addition to the various wording at the foot
of the pop-up you can also choose whether to have Smilies
displayed, whether to include a not applicable option and which
order you wish the response scale to run. The standard order
is from positive to negative.
To the left, above and below the current
section, are two links marked “add”. These enable you to enter a
new section or a page break above or below the current one…
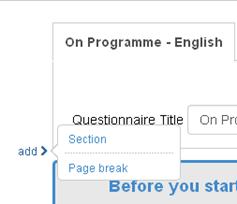
Adding a new section opens a window where you
can enter a name for the new section and select the type of section
you want. Alternatively you can use a QDP pre-defined
section. The pre-defined sections are populated with a full
set of questions from which you choose those you which to include
in your questionnaire. See section 5.8.4.
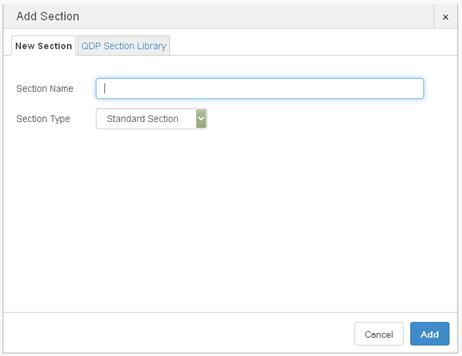
There are 3 types of sections in Survey
Manager
|
Introduction
|
|
Introduction sections replace the standard QDP introduction text
for online questionnaires. Only text items are allowed in
Introduction Sections. Only 1 Introduction section is allowed per
questionnaire
|
|
Standard
|
|
Standard
sections are used as containers for questions and text items. You
can add as many Standard sections as you wish in your
questionnaire. Each section is displayed on a separate page in
online surveys.
|
|
Extroduction
|
|
Extroduction sections replace the standard QDP Extroduction text
for online questionnaires. Only text items are allowed in
Introduction Sections. Only 1 Extroduction section is allowed per
questionnaire
|
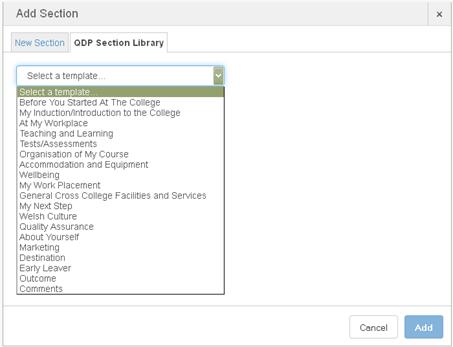
You can also add a section populated with
predefined questions by clicking the QDP Section Library tab and
selecting an appropriate one. See below.
Within SurveyManager a set of predefined
sections are included. These cover many of the common topics
which you may wish to ask in a questionnaire. To insert a QDP
section, click the Add to the left and above or below as
required.
When you select a relevant section from the
library, the questions contained within that section are
displayed...
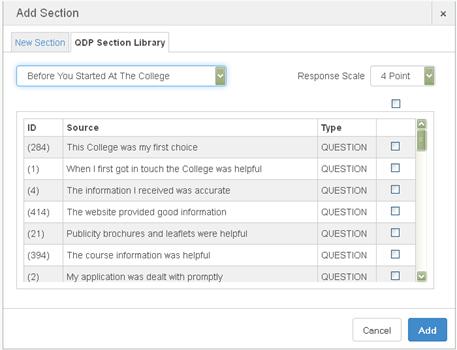
Click the tick box to the right of those
questions you wish to add to the section. If there are many, you
can simply tick the box above the other tick boxes to select them
all. You can also select whether you want any rated statements to
have a 2-point, 3-point or 4-point scale. When done, click Add to
return to the questionnaire.
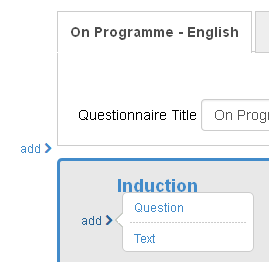
To add a question to a section, click the
“add” link in the left hand side of the section and select
“Question”…
SurveyManager supports four types of question,
as we’ll see in the following subsections. In all cases,
there are a couple of things to be aware of:
- If you include a library question in a
questionnaire and change the text of the question, the changes you
make need to retain the sense of the question. For example, a rated
statement question that reads, “I am happy with the college” should
not be changed to “I am not happy with the college” because the
sense of the question will be inverted.
- Once you select the type of question, the
type and several other pieces of information become fixed because
they define the question in the database. You may however edit
other aspects of each question type as detailed below.
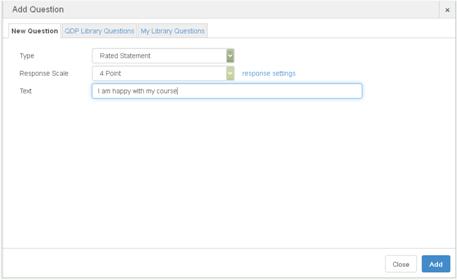
Rated questions are those against which the
target must pick an amount by which they agree with a related
statement. SurveyManager supports questions of this type with two,
three and four levels of agreement or points. The wording to
be used, the order of the scale, the display of Smilies and the Not
Applicable option can all be selected by clicking the response
settings. See section 5.8.2.
Rated statements are also the only type of
statement that provides comparison using distance travelled,
internal or external benchmarking and it the latter case the
statement must be a QDP matrix statement. Multiple choice
questions will not provide these comparisons.
Once created, you can change the text that
goes with the question. The first rated question within a
section also sets the response scale to be used for the entire
section. Therefore, once you have added a rated statement you
can only change the response scale by changing the scale used
within the section. See section 5.8.2. The type remains
fixed.
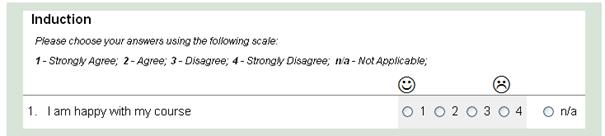
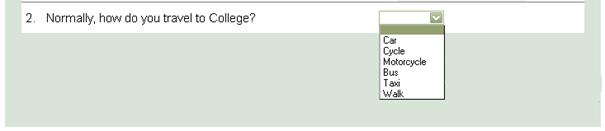
In the survey, using the default selections
for the response scale, the question will appear as follows:
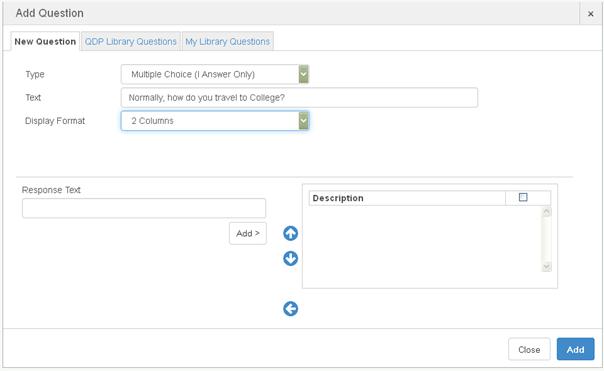
The display format determines how many
columns, between 1 and 4, the responses will be laid out in on the
printed questionnaire. Online questionnaire will display the
responses as a drop down list to ensure a single selection is
made.
Responses are added by typing the required
text and clicking the add button. To speed up the entry of
response texts, you can enter them on one line separated by commas
“Car, Cycle, Motorcycle, Bus, Taxi, Walk” in our example. Click Add
and SurveyManager will separate them into individual options in the
right hand list. If you use this facility, remember to begin each
option with a capital letter if you want each option to have an
initial capital in the survey.
When you have added all the required
responses, select the ones you want in the right hand list by
clicking their associated tick boxes and then click “Add” to return
to the questionnaire.
If you need to change the order of the
responses, click Edit to open the question’s edit options, and
click edit again on the menu that appears. Select the option whose
position you wish to change in the right hand column and click the
up and down arrows. Click “Add” when you’re done. The online
version of the questionnaire which uses a drop down list of options
for multiple-choice single answer questions will appear…
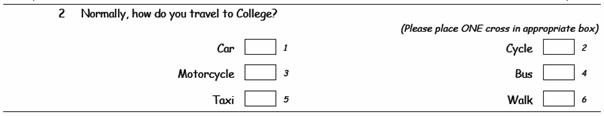
The printed version will show all options
along with the instruction to only place a cross in one box. This
is where the number of columns you selected for the options comes
into play…
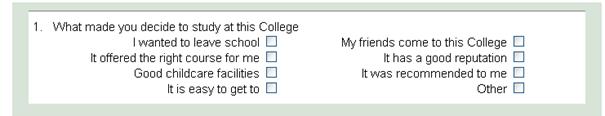
Multiple-choice questions where the target can
select more than one response are entered in the same way as above.
However, in web-based questionnaires, the number of columns is
significant because all choices are presented for selection rather
than being part of a drop down list. With two columns, the question
will look like this…
Free text questions are ones in which the
target can capture their thoughts, feelings and opinions…
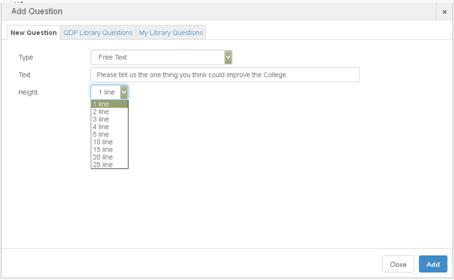
The number of lines affects the size of the
text entry box.
Questions, text and sections can be moved by
dragging them and dropping them where required. If a rated
question is moved from one section to another its response scale
will be changed, if required, to reflect the new section. The
scale change will cause all answers collected against the current
response scale to be lost.
Within section 5.8.4 we learnt how to add
complete sections of QDP’s predefined questions. You can also
add a single question from the QDP library of question by selecting
the appropriate tab…
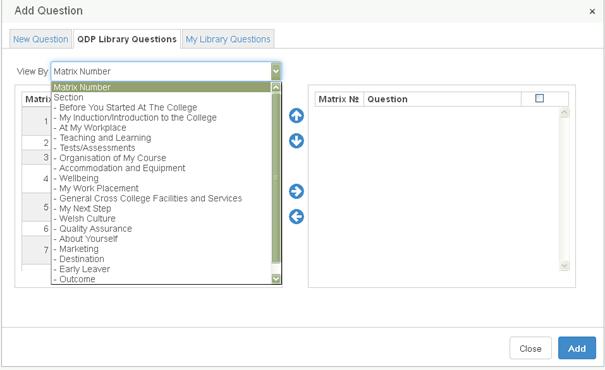
The questions can either be chosen using QDPs
matrix number (these can be found in brackets next to the question
number within previous questionnaires or QDP examples) or by
picking questions from a section in a similar manner to selecting
sections.
A question can be deleted at any time however;
if answers have been collected against the question then these will
be lost. Replacing the question with the same question again
will not bring back the deleted answers because SurveyManager will
treat the replacement question as a completely new question.
This also applies to responses within
questions. Each response is a unique identified by
SurveyManager and thus if deleted all answers collected against it
are lost. Creating a new response spelt exactly as the one
deleted will not recover the answers.
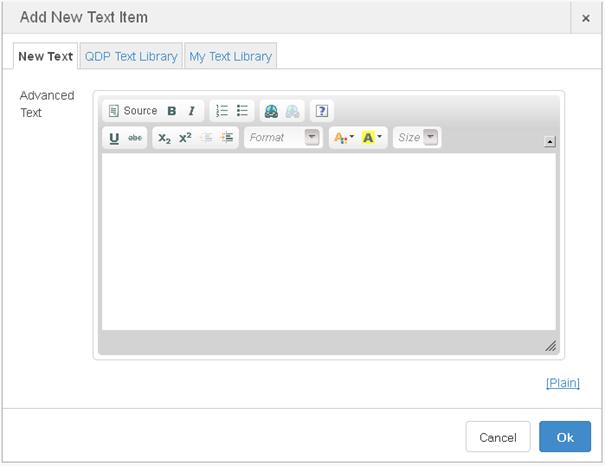
To add text to a section, click the “add” link
on the left hand side of the section and click text. You can
type plain text in the box displayed and click Ok.
If you want to add formatting you can click
the “advanced” link at the bottom left. The screen below can
then be used to enter formatted text. You can also paste
text, pictures and html created in other applications such as
word.
You can create your own library of
questions. This only needs to be done if there are QDP
question wordings that are particular to you that you wish to keep
or you have a new question that you want use in other survey
projects.
Choose the “edit” button next to the question
you wish to keep and select “add to my templates”.
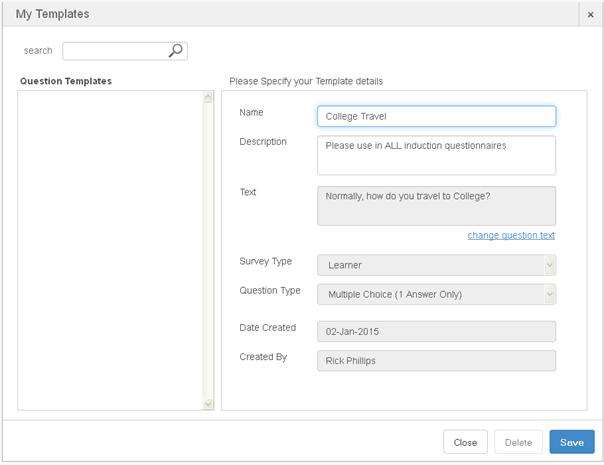
Ensure that a meaningful name is given to the question before
adding it to your library.
When you
are adding questions you can find your previously stored questions
on the My Question Library tab. This operates in the same way
as the QDP Question Library which is described in section
5.8.4.
Targets are the people who will complete one
or more questionnaires as part of a survey. They contain the
details of which questionnaire is to be completed by which group
and additional contain all the details of that group which are used
to produce the reports. The entries you made in the
organisational structure, see section 3.4.4, are used to help
validate the target list to ensure the required information is
included to give the correct reports.
If your survey contains a single questionnaire
and is targeted at a single group you can use a simple one line
target list.
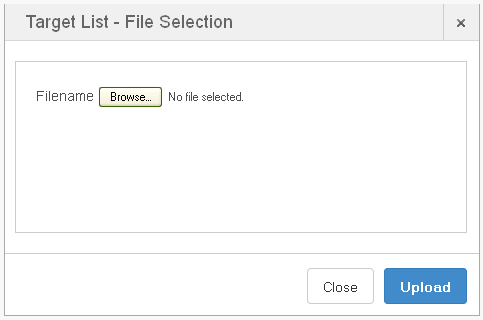
To create a target list you can either enter
the information into a blank sheet generated by SurveyManager or
load an Excel sheet exported from your MIS systems.
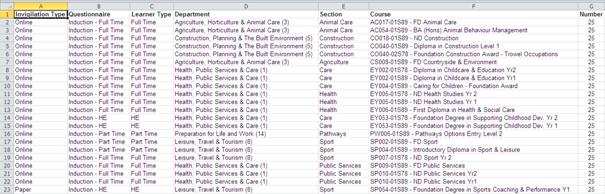
For the purposes of target list we have used
QDP’s standard Induction – Full Time and Induction – Part Time
questionnaire models within the survey project.
To generate a blank spreadsheet to populate,
click the “open blank target list model” link. You’ll be prompted
to open the generated file. Click “OK” to continue.
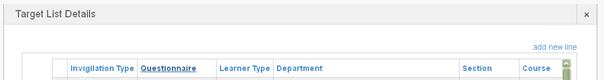
The generated blank target list will always
contain three standard columns, as follows…
- Invigilation Type
- Questionnaire
- Number (of targets)
Entries in the invigilation type column can be
one of the following standard types:
- Paper
- Telephone
- Mailer
- Online
- Email
Each row in the spreadsheet defines a
particular group of targets. In the questionnaire column for a
particular row, you add the name of the questionnaire you want that
group to answer, and the number column you put the number of
respondents you need for the questionnaire. The Questionnaire must
be the exact same name as you have given to one of the
questionnaires in your survey project.
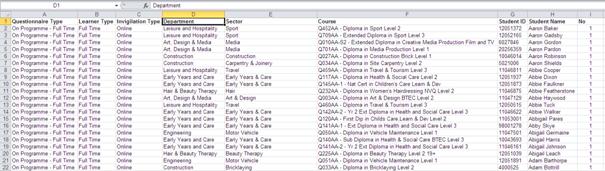
The entries made in the organisational
structure for the survey’s particular type are reflected in the
headings of the other columns. Please don’t change the names of any
of the columns…

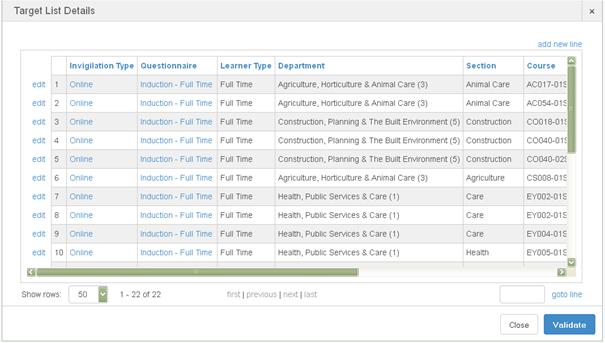
Your Target List is displayed as a series of
pages. The size of the page can be altered by changing “Show rows”
at the bottom left of the screen. The example only has a
single page. However you can see that there are facilities to move
through the pages and to jump to a particular line within the
list.
A target
list must be validated in Survey Manager before it can be used.
Click the Validate button to start the process.
The
validation process will check the Target List conforms to a set of
standards. These include:
Once your target list is populated, loaded and
verified, you can export it into its own spreadsheet by clicking
export. This is useful when you want to use it for another survey
with the same organisational model.
If you wish to delete the current target list
before you have published the survey, click Delete and confirm the
deletion. Once the survey has been published target list rows can
be deleted one by one. If no targets have completed the
questionnaire the delete will have no effect on the survey results.
Note, however, if any questionnaires have been completed
against any row you are deleting then all answers collected against
these rows will be permanently lost. Reloading the same target list
will not restore the answers. Once you delete the current
target list you can create a new blank one and load it.
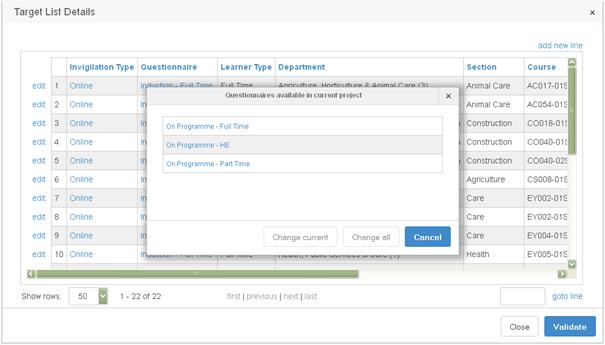
The popup
over will be displayed.
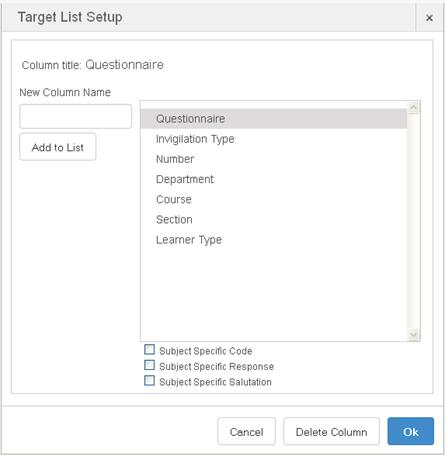
To change
the current allocation of the column, simply pick another from the
list. To change the name of a column name you can add the new
name to the list by using the add feature on the left and then
select the newly added entry from the list.
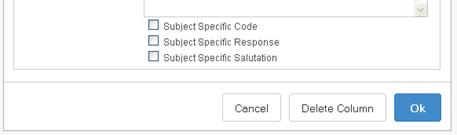
A column
can also be removed from the target list by selecting “Delete
Column”. This will permanently remove the column.
Once the survey has been published it is still
possible to add targets to the target list. The survey must
be Paused to do it which means that no online questionnaires will
be available for completion whilst the additions are being
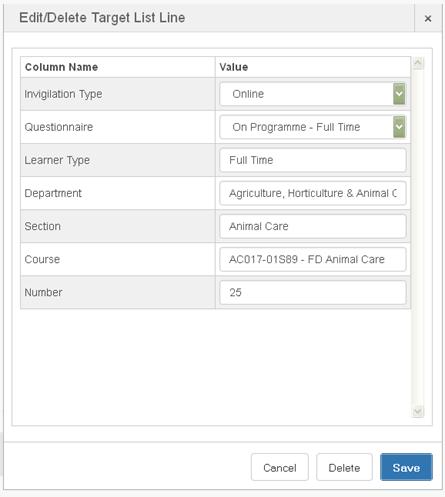
made. There are two ways of adding rows to the target
list:
·
Manually type additional rows by clicking the Add (new line) button
on the right just above the target list; this will open a new
window for you to type in all of the required details.
·
Load a second target list containing ONLY the additional
rows. The columns of the new target list must match exactly
the columns of the loaded list. You can ensure this is the
case by exporting the current target list, deleting all of the
current row apart from the header row and then adding the new
rows. Note: If you do not delete the rows from the
exported excel sheet these will be duplicated in your loaded target
list.
Once you are happy with your questionnaire(s)
and have successfully loaded and validated your target list, you
can publish the survey so that the target groups you have defined
can complete their questionnaires.
Back on the home page, click the “view” link
within the Actions column next to the appropriate survey
project. The popup now includes the “Publish this Survey”
action. Publish will create all the online and paper questionnaires
ready to be used. Click this and the following window
appears…
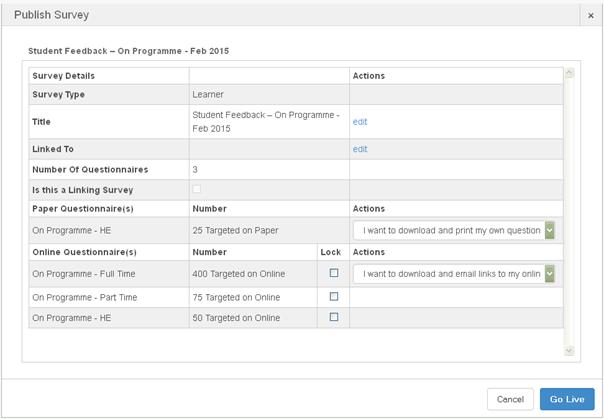
The top section shows you the survey project
details and provides a last opportunity to amend both the project
title and link survey project for distance travelled.
In the centre of the screen and if and only if
the target list has been set up as subject specific (see section
6.6) you can select to chain the questionnaires together.
This takes each questionnaire that is targeted to a “subject”
within the target list and forms a single questionnaire from those
listed. The questionnaire is then ask as if it was a single
long questionnaire
Each of the Invigilation types used in
the survey will be listed. These are:
·
Paper Questionnaires. Each questionnaire model will be listed
with the numbers to be targeted. Under action you can choose
whether to print the questionnaire or to get QDP to print them in
which case you should contact the Customer Services team to confirm
specific delivery dates and costs. If you choose to print them you
can enter any completed questionnaires into SurveyManager by typing
them by hand at any time or you can send them to QDP for
processing. If you choose the latter please, as far as
possible, ensure the following:
o The
questionnaires are printed on A4 plain white 80 grm paper
o Where
practical a single printer is used
o They can
be printed double sided but it’s important to choose to print
single or double sided for ALL questionnaires
o If there
is more than one sheet please staple them on the top left hand
corner ensuring the is a sufficient gap between the staple and the
skew marks (the small black squares)
·
Online questionnaires. Three options are available:
o I want to
download and print instructions to access my online
questionnaire. Use this to create sets of invigilation sheets
to distribute to the various target groups
o I want
QDP to print and pack instructions to access my online
questionnaire and post them to me. As you might expect invigilation
sheets will be created and batched in envelopes by QDP before being
despatched to you
o I want to
download and email links to my online questionnaire. A copy
of the target list is created with the links to access the correct
survey held in extra columns.
For online
questionnaires you can select to lock the survey for each cohort
once the targeted number of people have completed the
questionnaire.
·
Telephone. Two options are available:
o I want to
telephone my targets and complete my questionnaires: - A copy of
the target list with the appropriate codes is produced and the
results can be typed directly back into SurveyManager. If
preferred you can use the online invigilation to collect the
results but still phone the targets.
o I want
QDP telephone the targets and complete the questionnaires for me: -
Please contact our Customer Service team to confirm any specific
arrangements and dates.
·
Mailers. Two options are available:
o I want to
download, print and mail my questionnaires. A copy of the
target list with the appropriate codes is produced and the results
can be typed directly back into SurveyManager. If preferred
you can use the online invigilation to collect the results but
still phone the targets.
o I want
QDP to print, pack and mail my questionnaires. Please contact our
Customer Service team to confirm any specific arrangements and
dates.
·
Email. Two options are available:
o I want to
download and email links to my online questionnaires. A copy
of the target list with the appropriate codes is produced which can
be used to mail merge.
o I want
QDP to email links to my online questionnaires. Please contact our
Customer Service team to confirm any specific arrangements and
dates.
When you are happy with everything click “Go
live”.
The final tab displayed at on the left relates
to additional services you wish to order from QDP. Clicking
the tab will display the following screen…
At the foot of the screen there are further
options associated with the project each of which will incur
additional charges…
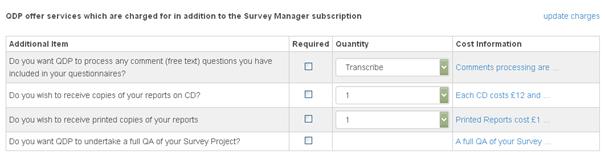
QDP will type any paper comments or for online
surveys will read and remove swear words and names. If you
choose not to ask QDP to read comments they will appear as typed by
the targets into SurveyManager.
Your reports will be available on
SurveyManager but if you wish you can request a copy on CD to load
to your intranet or for safe keeping.
The reports will be not normally be printed:
individual reports can be printed directly from
SurveyManager. If you would like a full set of printed
reports select yes and contact our Customer Services team to
confirm your requirements.
Finally, you can request QDP to undertake a
full QA of the project to ensure everything is set-up correctly,
that the questions are sensible and cover relevant issues and the
target list will produce the expected reports. If you request a
QA do not set the survey live until you have received confirmation
from us that the QA has been completed.
Once the survey is published, when you view
the Actions, the options for the survey have changed…
Click “Distribute this Survey” and the
following window will appear. This gives details of all the links
to online surveys and links to printable PDFs of questionnaires
within the survey…
Each questionnaire within the survey project
with a distinct invigilation type appears on its own line. In the
case of printing, for example mailers, you may receive multiple
documents each of which will appear on a separate line.
Two Actions are available:
Click download to access a csv spreadsheet
containing the appropriate original rows of the target list
together with three extra columns on the right.
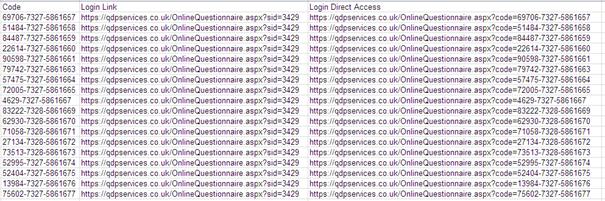
The first extra column contains a unique code
linking the target group and its questionnaire. The second is the
general login link for targets to use in conjunction with the
associated code to log in and complete the relevant questionnaire.
The third column is also a link, which will log each target in and
present the questionnaire to them directly. These links can be sent
via your preferred invigilation method to the targets so that they
can fill in the associated questionnaires.
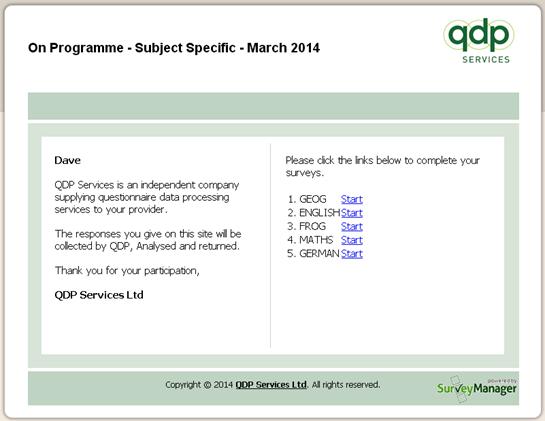
Following the login link, the target will see
the following screen, where he/she can enter the code to access the
relevant questionnaire…
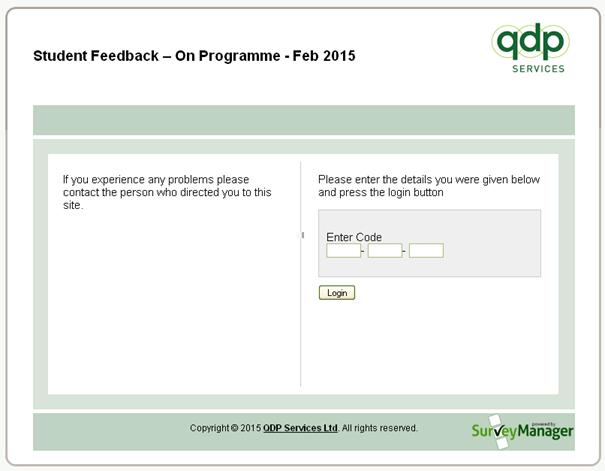
When using direct access the above screen
changes slightly in that a single field is given to enter the
required code, normally their student Id. The second extra
column, Login Direct Access, allows the target to access the
questionnaire directly without going through the above screen.
Note that the targets do not need a
SurveyManager account setting up to complete their
questionnaire.
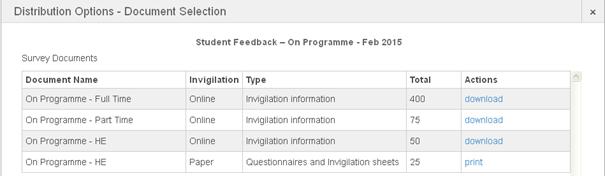
The print action will pop a screen to allow
selection of the documents to be printed…
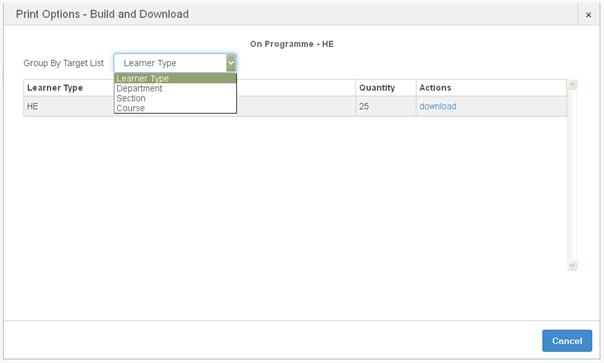
All printed material is created in the form of
a pdf file. For small print quantities the whole batch can be
downloaded ready for printing at once. If the print
quantities are large they can be split into manageable chunks using
any of the columns within the target list.
Note: Large print files may take a
considerable time to create and can be broken down into small
sections which will speed up the overall time taken.
If you have opted to print off your
questionnaires and have them filled out by hand, you will need to
input the results. On the home page, click the relevant survey’s
“input” link. The following page appears…
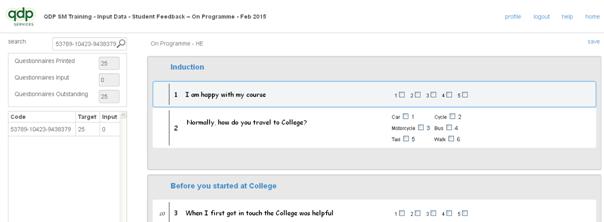
On the left you can see the total number of
questionnaires printed off for the survey, the number of
questionnaires already input (initially zero) and those still left
to be input. Below this is a list of the individual questionnaire
codes along with the number of targets and the number of
questionnaires entered. Copy the code for the questionnaire you
want to enter into the search box at the top. Press enter and the
questionnaire appears, ready for you to enter the data from the
printed copy. You can use the keyboard to type the responses rather
than clicking using the mouse. When you have entered all the
answers, click Save to continue. The number of questionnaires
input and the number outstanding will change accordingly.
As the targets begin to return completed
questionnaires, you can monitor their progress. In the reports
column of your survey on the home page, click “Returns”. The
following page appears…
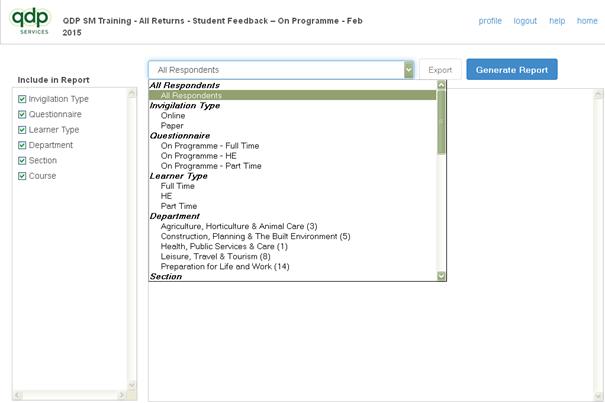
At the top of the page is a pull-down list
enabling you to select a specific part of the target list to
report. On the left are the columns from the target list. Each has
a tick box for you to include or exclude them from the report
allowing you to view specific cohorts within a particular part of
your organisation structure. Click “Generate Report” to update the
display with the new settings. The report gives the number of
targets who have completed questionnaires. The yield column gives
the percentage of targets within a target group that have completed
their questionnaire.
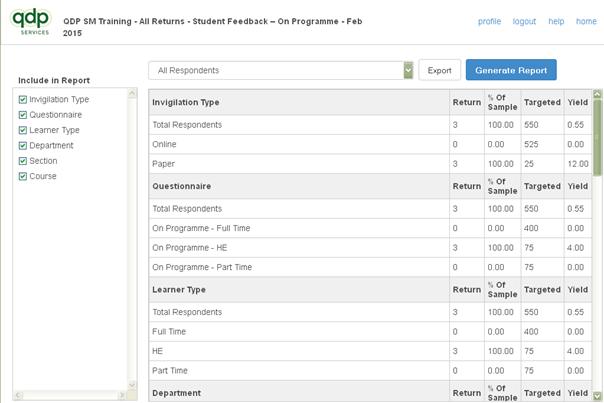
When a large target list has been used within
a survey, it is advisable to select a section of the targets using
the drop down box.
The report shows the returns received,
percentage of the total sample, number targeted and yield achieved
for the chosen section of the target list and detailed by each
column selected.
The report can also be exported to Excel by
clicking the Export button once it has been enabled. This
will copy the displayed all return into an Excel file.
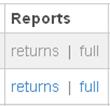
Clicking the ‘Report’ button under Actions
will request a full set of reports using the results collected to
date. Due to the volumes of data and reports these are run as
a batch process. Once completed you will be notified by email
and the full button against the survey on the home page will become
available. To view your reports, click on Full.
QDP will
set-up your reports and once done will send a email notification.
The reports themselves are detailed in section 8.
You can pause a published survey at any time
by clicking its associated “pause” on the home page. This suspends
the survey and allows you to make changes to its structure and the
target list. Once complete, re-publish the survey to continue.
Deletion of target
rows, sections, questions or responses will cause any data
collected against them to be lost.
Archiving a survey ends it completely. Note
that this is irreversible and should only be done to surveys that
have been completed and when you are happy that you have received
all of the required reports.
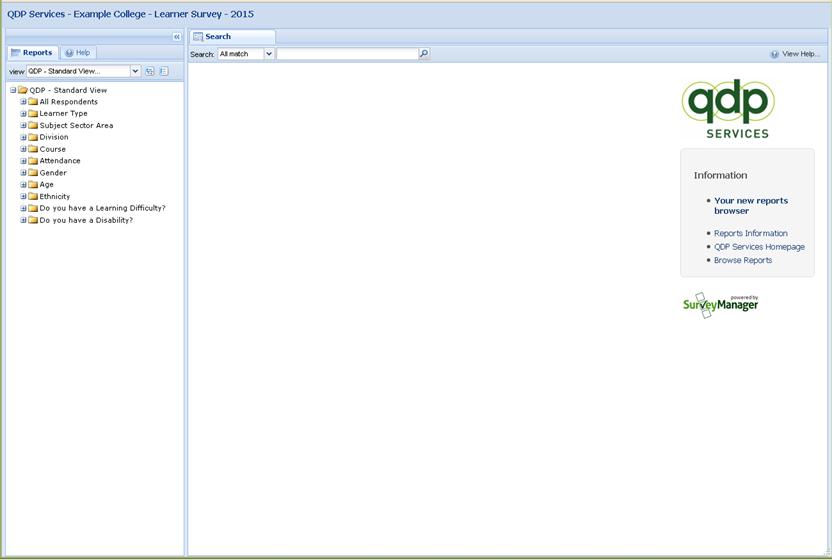
The full set of reports is displayed in a
browser similar to Explorer and is accessed by clicking the reports
link for the appropriate survey on the home page.
A screen
similar to explorer will be displayed…
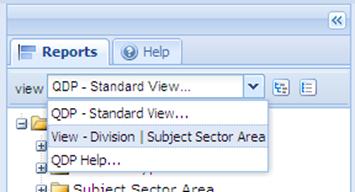
On the
left hand side of the browser underneath the survey project title
is a drop down list which allows you to select the chosen tree to
view. The list shows all the trees available and will include
a QDP – Standard View which gives access to all the reports for the
columns within the target list and the demographics. It addition,
where sensible, there will be a tree structure that matches your
organisation management structure. There is also an additional help
available.
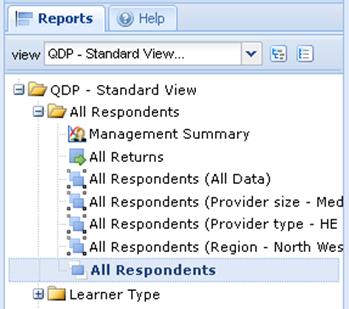
When you
select a tree it will be displayed in the panel below with all
nodes collapsed. In the tree, nodes appear as folders
similarly to directories within Explorer. The reports
themselves have blue symbols which indicate the type of report to
be displayed.
To expand
and collapse nodes simply click on them. The various files or
sub-nodes will appear as shown below. Once a report is
selected and clicked it will appear in the right hand panel of the
browser.
Each
report chosen will display it is own reports tab within the reports
panel on right.
To
quickly expand or collapse all the nodes in the tree use the 2
icons displayed next to the drop down list…


Each report style is described in detail
within the following sections of the manual. Within this
section only the additional elements available to navigate around
the report and to preview and print them are explained.
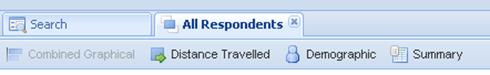
On the top left of the reports panel
underneath the tabs one or more report styles will be listed.
In this case a Combined Graphical which is greyed because it is the
one being displayed, Distance Travelled, Demographic and a Summary
Report. To display the Summary Report click on the link and
it will replace the current report being displayed.
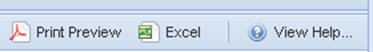
On the top right hand side the reports panel
you can select:
·
Print Preview which will pop-up a pdf of the chosen report;
·
Excel which will pop-up the full Excel workbook of the chosen
report.
In addition the help files can be
displayed.

Within some of the reports, in particular the
Combined Graphical, the full report is spread over several
sheets. In this case, a Combined Graphical Report, there are
4 sheets of information included. To flick between them click
on the chosen button.
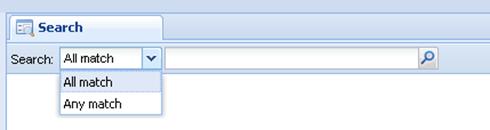
The
search tab, which is always the first tab displayed, allows you to
use key words to find particular reports.
You can
either:
·
Search for a report containing all the key words you type. In
the case a search for gender male would only return the reports
relating to male respondents.
·
Search for a report containing any of the key words typed. In
which case a search for gender male would return reports relating
to both male and female. The female being included as they
have a single keyword matching your keyword gender.
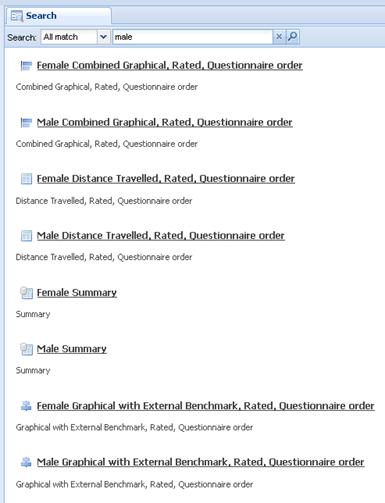
The
results of the search are displayed within the tab.
The help panel shown on the left can be
displayed by either selecting the tab above the reports tree, shown
in our example or by clicking the button on the left hand side of
the reports panel.
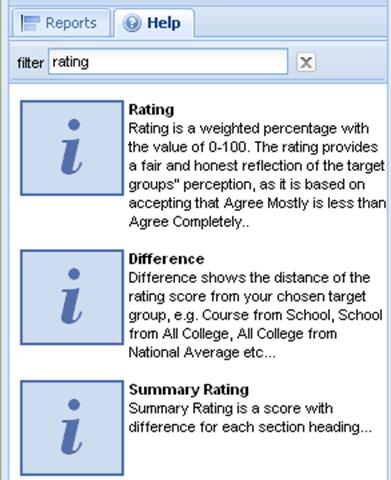
Clicking one of the entries will display a tab
containing all the full help information.
You can also search the list by typing key
words into the filter.
The Combined Graphical Report provides a full
analysis of the results for any cohort within the survey
project. The results are shown for each rated question within
the survey in 5 different ways:
·
As a graph.
·
As the raw data. Colour coded to provide a key to the graph.
·
As comparison of each question against the results for all the
respondents to the survey or against a chosen cohort.
·
As a comparison of each question against an appropriate external
benchmark if available.
·
As a comparison against a previous surveys results if
available.
Within the report set a Combined Graphical
Report will be produced for each cohort targeted and for each
cohort within the demographics.
Each report contains 4 sheets:
·
The Report Sheet (Section 9.1)
·
The Demographics Sheet (Section 9.2)
·
The Stats Sheet
·
The Questionnaire Usage Sheet
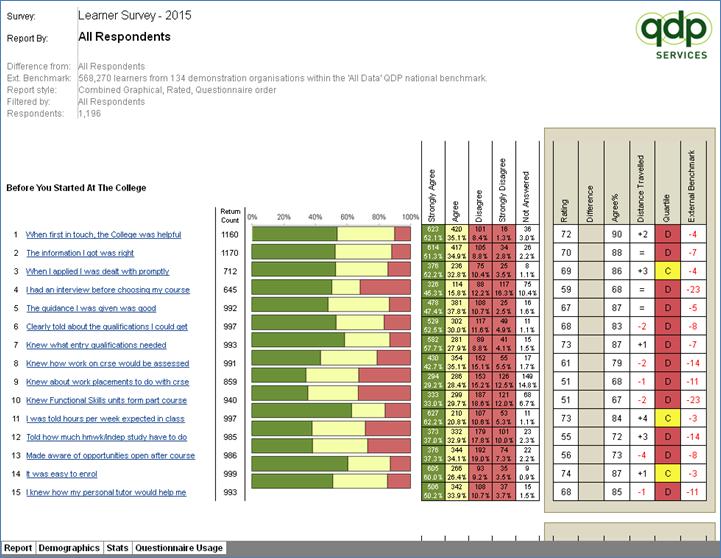
The Report Sheet provides an easy to read
analysis of the results for any cohort within the survey project.
It is split into 5 sections:
·
The headings
·
The questions
·
The graph
·
The data
·
The calculated numbers
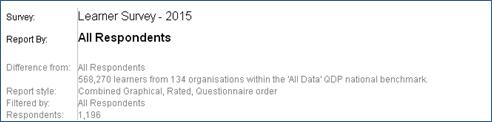
The headings of the Combined Graphical Report
describe:
·
The title of the survey project.
·
The cohort being analysed. (Report by) In the example “All
Respondents” to the survey project.
·
The report style is given for reference. Obviously a Combined
Graphical Report. This report is produced using QDP rating values
for the calculations and comparisons. In addition in this example
the questions are output in questionnaire order. They can also be
produced using a relevant inspection or other framework.
·
The Filtered by indicated whether the respondents included in the
report have been selected by using other criteria over and above
the main cohort. The number of respondents included within the
report. For example you may include within a course report only the
respondents from a particular site.
·
Your logo will be displayed on the left.
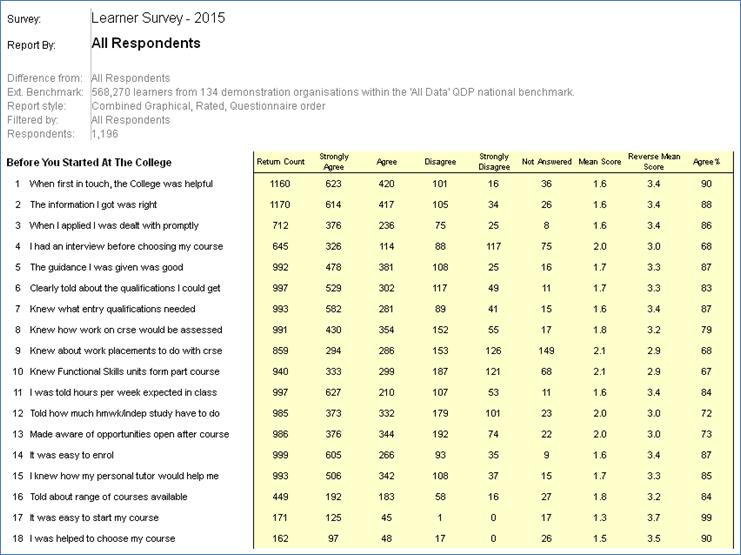
The questions chosen to be included in the
reports are shown on the left. The questions can either be
analysed using the sections and order in questionnaire or using an
inspection or other relevant framework.
The graph down the centre shows the responses
to each of the questions. The key to the colour coding of the
graph is provided by the colours within the data section of the
report. If you have used QDP’s standard response scale and colours
the green will represent the strongly agrees, the yellow the agrees
and the red will be all those who Disagree or Disagree
Completely.
If another response scale has been chosen the
green will usually represent the strongest positive, the yellow all
other positives and the red the negatives.
The graph also excludes anyone who did not
answer a particular issue.
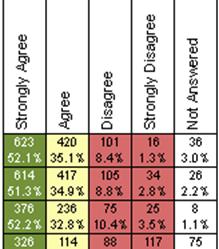
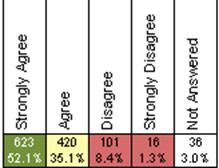
The data used within the report is shown down
the centre of the report. These are the counts of those
answering each particular response, Strongly Agree to Strongly
Disagree. The Not Answered is those that chose not to express
an opinion either by choosing not applicable or by not selecting a
response at all.
As mentioned previously the total number
included within the report is shown at top of the report just under
the headings.

Working from left to right, from data the
following are calculated:
·
The return count – this is the number of respondents who
expressed an opinion. This is everyone who answered the
particular question excluding those who answered not
applicable.

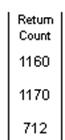
If one of the
totals is lower than the others it may indicate a question has been
poorly understood. Note: if you have used multiple
questionnaires in a survey project and a given question has only be
asked if one of them this may also cause lower response rates.
If the return
count of a particular question falls below 10% of the reports total
number of respondents the statement will be greyed to highlight
that there may be problems with this statements results.
·
Agree % - Close to the centre of the shaded figures on the
left of the graphis the calculated agree%. This is the total number
people who gave a positive opinion expressed as a percentage of the
return count. On the graph this is the right hand end of the
yellow bar. In the case of the first question this is 90%


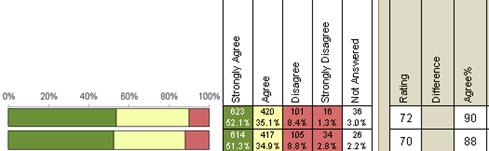
·
Rating – Just to the right of the graph is a weighted percentage
which provides a measure of the strength of agreement. A full
explanation is given in section 19.20 In terms of the above graph
it is calculated using the same data as the Agree % except each
person who only agreed is discounted by half. The calculation
is count each person who agreed strongly as 1, all those who agreed
as ½ and expressing this as a percentage of the return count. In
this case for the first question the rating is 623 + (420 *0.5)
divided by 1160. Which is 833/1160 or 71.8 which is given
rounded to 72.
In terms of the
graph the value will be half the way along the yellow.


The Rating will
give far greater differentiation than the Agree %. For example if
everybody agreed strongly the agree % would be 100 and the rating
would be 100. If on the other everybody only agreed the agree
% would still be 100 but the rating would be 50.
·
Difference – is a comparison of the rating against the
chosen difference which is detailed in the title.

In this case no difference is given as there will not be one
between the chosen sample “All respondents” and the chosen
difference “All respondents”. It is therefore greyed.

Distance Travelled – gives a comparison of this survey
against a previous one normally the previous year.

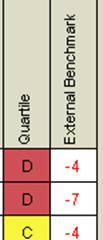 Quartile and External
Benchmark – columns provide a comparison against QDP’s national
benchmarks. An appropriate benchmark will be used and the one
chosen shown within the titles of the report.
Quartile and External
Benchmark – columns provide a comparison against QDP’s national
benchmarks. An appropriate benchmark will be used and the one
chosen shown within the titles of the report.
The external benchmark itself is shown in two different ways:
o A
quartile figure A (The top 25%) to D (the lower 25%) of
organisation within QDP’s sample. In this case 134.
o Second as
a difference from the average of the respondents within the
benchmark. In this case 568,270 learners.
·
Summary – this line at the foot of each section is a summary
of the above statements scores. This is not an average of the
above it is calculated from each individual value from
scratch. Similarly the difference is calculated using the raw
data not averaging the figures displayed. This is done to
ensure that poorly answered questions do not distort the summary
figure.
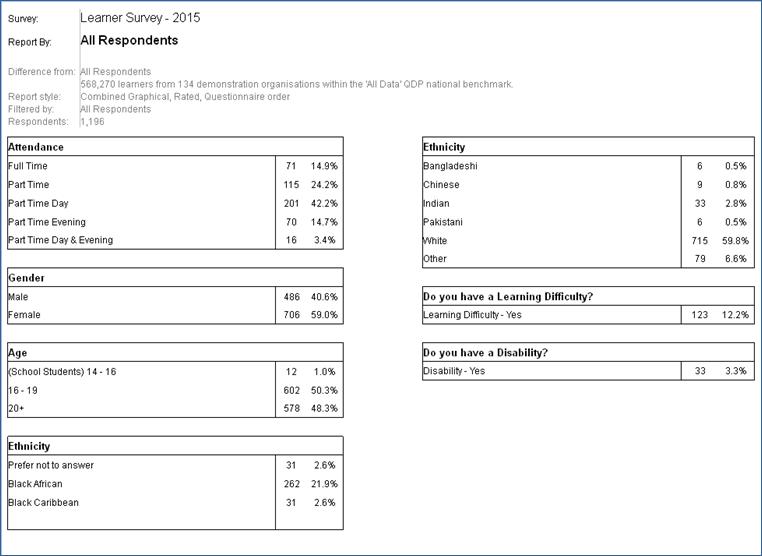
The Demographics Sheet details how the
respondents within the report are split in terms of their
demographics. For example, age, ethnicity and gender.
The headings are a repeat of those on the
Report Sheet. See section 9.1.1.
The questions included are those identified as
being demographics within the questionnaire and the target
list. The identification is done by QDP Matrix number.
For each demographic the respondents are
broken down. The number and the percentage of the total
sample within the report are shown.
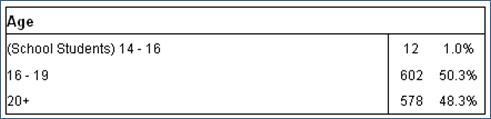
You will notice that for the Age demographic a
total of 1,192 are split down. The total number in the
report, shown at the top of the page, is 1,196. This
indicates 4 people did not select an age when completing the
questionnaire.
The stats sheet shows the answers given to
each question along with 4 additional calculated values:
·
Return Count – the number of people who expressed an opinion.
In other words it excludes all those who did not answer the
question or ticked not applicable.
·
Mean score – this is the average of the responses to the
question. It is calculated by numbering the responses from 1
upwards and from left to right, multiplying these response numbers
by the number answering the response and dividing by total number
answering.
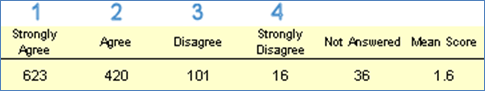
The above example
is calculated as follows:
Strongly Agree 623
* 1 = 623
Agree
420 * 2 = 820
Disagree
101 * 3 = 303
Strongly Disagree 16 * 4 = 64
Total
1,810
Divide this by the
total number answering 1,160. This gives 1.560 which rounded
is 1.6.
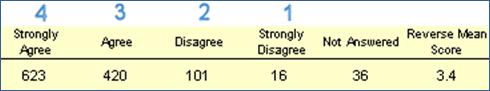
·
Reverse mean score – this is calculated as the mean score but
numbering the responses from right to left. The calculation
is the same as above using the new response numbers.
·
Agree Percentage – calculated by taking all those agree with a
statement and dividing by the number of people expressing an
opinion.
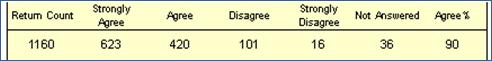
·
In the above example add the Strongly Agree and Agree, 623+ 420 =
1,160 and dividing by those expressing an opinion. 1,043 / 1,160
and express it as a percentage. This gives 89.914 which round
to 90%.
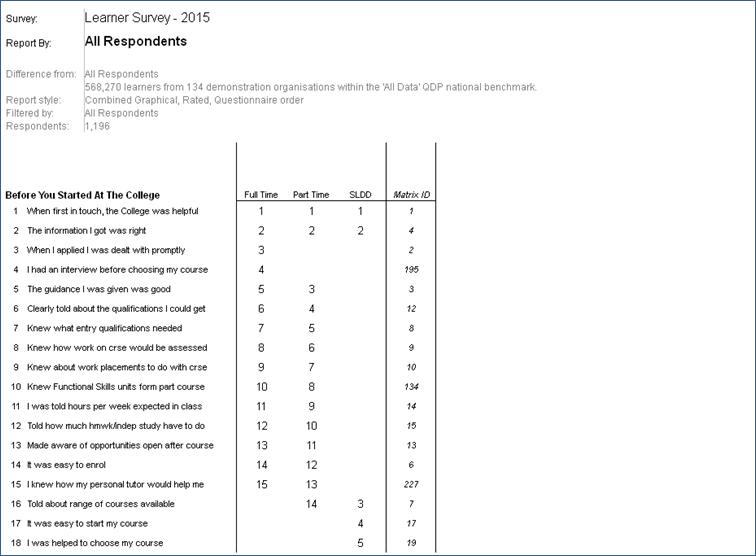
The questionnaire usage sheet will only be
included when more than on questionnaire model has been included
within a survey project. In our example three questionnaire
models have been used in the Learner Survey to target the various
learner types within the organisation.
The headings are a repeat of those on the
Report Sheet. See section 9.1.1.
The questions chosen to be included in the
reports are shown on the left. The questions can either be
analysed using the sections and order in questionnaire or using an
inspection or other relevant framework.
The columns of the report show where each of
the questions on the left appeared in the appropriate
questionnaire.
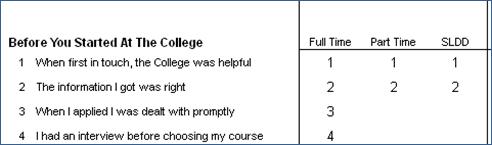
Our example shows that question 3 – When I
applied I was dealt with promptly was asked in just the Full Time
and the SLDD questionnaire was much shortened.
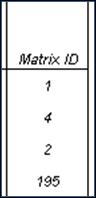 The final column on the right
shows which QDP matrix question the statement is mapped
against.
The final column on the right
shows which QDP matrix question the statement is mapped
against.
This will be used to benchmark question within
the report sheet.
The Summary Report is design to give a quick
view of the chosen cohort and to bring out strengths, weakness and
improvements.
It can contain up to 4 sections:
·
Response rate
·
Results Summary
·
Strengths and weaknesses
·
Improvements and concerns
In addition a second sheet gives answers to
some of the most frequently asked questions. The topics
covered are:
·
What is a Respondent?
·
What does a Return Rate of good mean?
·
How is Agree% calculated?
·
How is the QDP Rating calculated?
·
How is the Distance Travelled calculated?
·
What does the colour coding for Agree% and QDP Rating mean?
·
Which questions are included within each section of the Inspection
Framework?
·
Which questions are included in the 'Recommend' score?
·
How have the Strengths and Weaknesses been chosen?
·
10. What does the QDP Benchmark figure mean?
·
11. How have the Improvements and Concerns been chosen?

The Response rate is terms of:
·
The actual number surveyed and completing
·
The return rate as a percentage this represents
·
This return rate is then split in terms of the returns rates
achieved by other providers. This is given in the form of 5
divisions and reported as both words and colour coding of the chart
as shown in the table below.
·
The percentage is also plotted as a pie chart and colour coded as
detailed below:
|
Wording used
|
Colour code
|
Description
|
Explanation
|
|
Very poor
|
Red
|
in the bottom fifth of return rates
|
you are in the lowest 20% of return rates achieved
|
|
Poor
|
Yellow
|
is in the fourth fifth of return rates
|
60% of demonstration organisations achieved a better return but,
20% of demonstration organisations achieved a worse return
|
|
Average
|
Grey
|
is in the middle fifth of return rates
|
40% of demonstration organisations achieved a better return but,
40% of demonstration organisations achieved a worse return
|
|
Good
|
Light green
|
s in the second fifth of return rates
|
20% of demonstration organisations achieved a better return but,
60% of demonstration organisations achieved a worse return
|
|
Very good
|
Dark green
|
is in the top fifth of return rates
|
you are in the top 20% of return rates achieved
|

The results summary pulls out important areas
from the questions asked and summarises them. These could
include:
·
The overall perception – this takes into account all questions
asked
·
A particular inspection framework of other framework for example
Investors in People. The above report is uses the English
College Inspection Framework.
·
Recommendation if this question have been asked
·
Feeling Safe if there are appropriate questions
Each of the areas is described in 4 ways:
·
The Agree % for the questions or question summarised by
re-aggregating individual scores
·
The QDP Rating score again summarized
·
The Distance Travelled as a summary from the previous survey
·
The External Benchmark shown in the form of a colour coding. Red
being the lowest quartile, yellow, light green and dark green being
the highest and best.
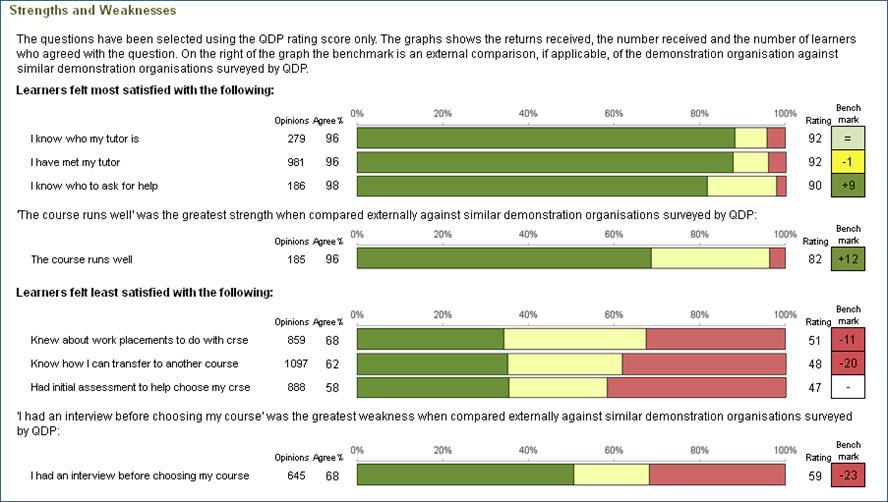
The
strengths and weakness section is comprised of four
sub-sections:
·
The firsts set of three selected questions are the areas of highest
satisfaction within the survey. They are simple chosen on the
basis of the QDP Rating score for each question. The top
three being chosen. In addition on the left of the graph an
appropriate external benchmark is also displayed to provide context
for the results. You can see above that the fact the learners
have met their tutor scores highly within the survey but this
result only places the organisation in the third quartile with a
below average score.
·
The single question shown next is the highest scoring question
compared to the appropriate External Benchmark. In this case
a question not appearing in the top three has been chosen.
·
The above is repeated for the lowest scoring 3 issues within the
survey.
·
Finally the lowest external score is also shown.

The
improvements and concerns are produced if a comparison is being
done with a previous surveys results. In a similar fashion to
the Strenghts and Weaknesses the following are drawn out:
·
The firsts set of three selected questions are the areas of most
improvement between the 2 surveys
·
The second set are the three questions where satisfaction has
fallen the most.
The Internal Benchmarking report provides a
quick statement by statement comparison of a selection of cohorts
against a company comparator. For example each ethnicity
against the all respondent figure or each course within a
department against its relevant departments figure.
It contains a single sheet and can be produced
using either ratings or agree percentages for the comparison.
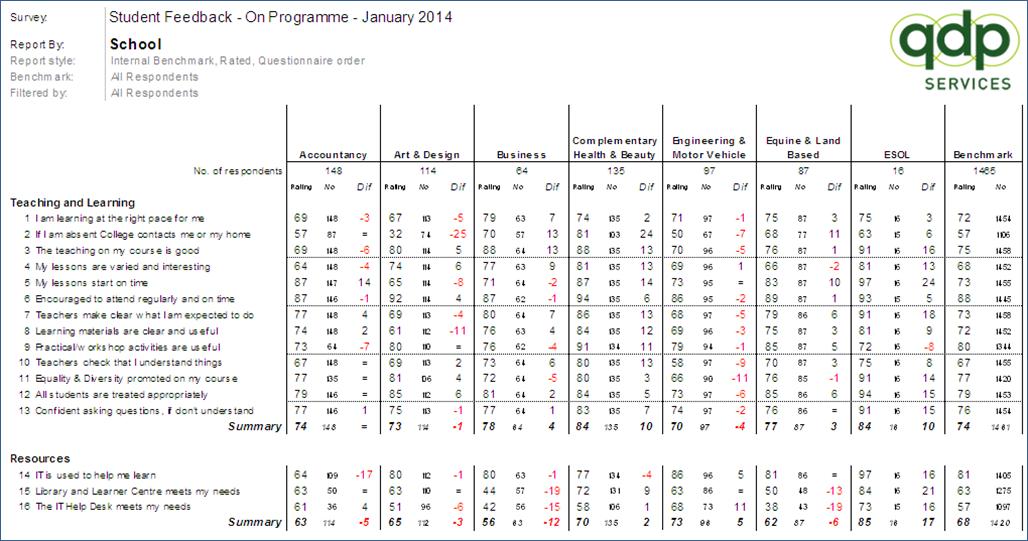

The headings of the Internal Benchmark report
describe:
·
The title of the survey project.
·
The cohort being analysed. (Report by) In our example school.
·
The report style is given for reference. In addition in this
example the questions are output in questionnaire order. They can
also be produced using a relevant inspection or other
framework.
·
Your logo will be displayed on the left.
The questions chosen to be included in the
reports are shown on the left. The questions can either be
analysed using the sections and order in questionnaire or using an
inspection or other relevant framework.
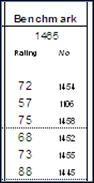 On the very right of the
report is the benchmark against which the rest of the cohorts
included in the report are compared. Each question has the rating
and number of respondent for each of the questions. At the
top of the two columns is the total number included in the
benchmark. In this case 1,465.
On the very right of the
report is the benchmark against which the rest of the cohorts
included in the report are compared. Each question has the rating
and number of respondent for each of the questions. At the
top of the two columns is the total number included in the
benchmark. In this case 1,465.
The benchmark being used is described in the
titles at the top right of the report.

In our example case we are benchmarking
against everyone who answered the survey and no filter has been
applied to further restrict the sample.
The remainder of the report shows each cohort
within the internal benchmark, in our case each school.
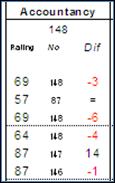 Taking the first column, the
Accountancy school, three figures are given:
Taking the first column, the
Accountancy school, three figures are given:
·
The rating for ach statement for the cohort
·
The number answering the given question for the cohort
·
The difference between the cohort rating and that of the
benchmark. For the first statement Accountancy scored 69
which is 3 below the all respondent benchmark.
Each section also includes a summary which is
calculated using the individual responses to the questions in the
section and not a simple average of the values in that section.
As its name suggests this report produces a
comparison of cohorts in the form of a league table. The
report is most often used to compare the teaching and learning of
the courses with a survey. However, it is possible to include
the responses to any questions, section or framework headings when
calculating the value to be used for each cohort. In addition
any cohort from your target list or the demographics can be
compared.
It contains a single sheet and can be produced
using either ratings or agree percentages for the comparison.
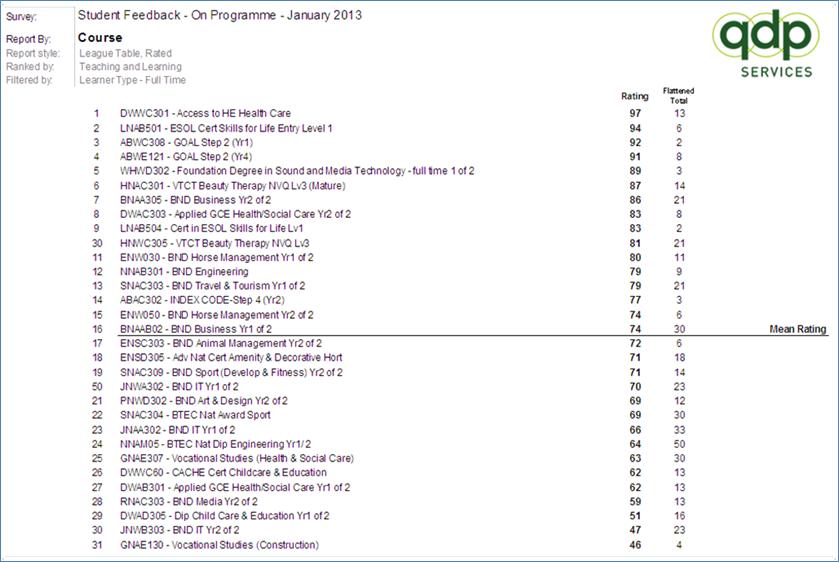

The headings of the Internal Benchmark report
describe:
·
The title of the survey project.
·
The cohorts being ranked within the league table. (Report by) In
our example Course.
·
The report style is given for reference. Note the report can be
created using Ratings or Agree Percentages.
·
Your logo will be displayed on the left.

The cohorts being ranked within the league
table are described in the headings. First the “Report by” details
the target list column or demographic question being used. (in our
case Course) In addition the cohorts can be restricted by
applying a filter. In our case we have chosen to only include full
time learners and therefore full time courses within the
report.
The questions used to create the overall score
for each cohort which is then used to rank them is described in the
headings…

In our example we have chosen the teaching and
learning section of the questionnaire. All the individual
scores for each of the questions within the section we used to
create an overall rating score for the chosen questions.
These cohorts and then ranked based on this
score.
Any section, question, group of questions or
framework heading can be used to rank the cohorts.
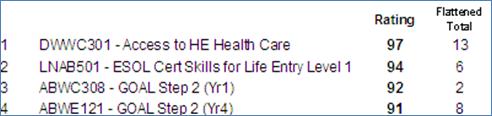
Each cohort is shown in descending order of
overall rating. For each cohort the following is given:
·
The position in the league table
·
The name of the cohort
·
The rating calculated for the chosen questions
·
The number of respondents included in the cohort. This is
provided as a check to ensure a reasonable sample is being
represented.
The mean rating is the average score of all
the included cohorts. It is not always half way down the
table.
As its name suggests this report produces a
comparison of cohorts in the form of a league table. The
report is most often used to compare the teaching and learning of
the courses with a survey. However, it is possible to include
the responses to any questions, section or framework headings when
calculating the value to be used for each cohort. In addition
any cohort from your target list or the demographics can be
compared.
It contains a single sheet and can be produced
using either ratings or agree percentages for the comparison.
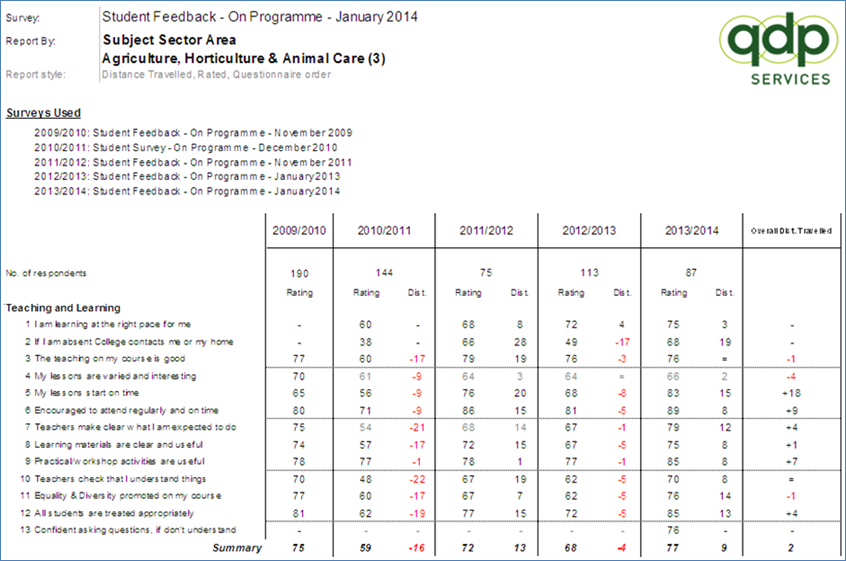
The headings of the Distance Travelled report
describe:
·
The title of the survey project.
·
The cohort reported. In this case the Agriculture,
Horticulture & Animal Care sector subject area.
·
The report style is given for reference. Note the report can be
created using Ratings or Agree Percentages.
·
Your logo will be displayed on the left.
The surveys used to form the distance
travelled are listed at the top of the report.
The questions chosen to be included in the
reports are shown on the left. The questions can either be
analysed using the sections and order in questionnaire or using an
inspection or other relevant framework. Note: the questions
are taken from the current survey project.
The oldest survey forms the starting point for
the distance travelled. The ratings for this survey are in
the left most column. Where a particular question was not
asked in the year a dash is printed.
Each subsequent year gives the figures for the
year and where possible a distance travelled from the previous
year.
The final column shows the overall distance
travelled from the first survey to the last.
For each year the number of respondents within
the cohort is given. Finally a summary score for each section
is included. This is not an average of the individual
question score it is calculated from each individual respondents
answers from scratch. This is done to ensure that poorly
answered questions do not distort the summary figure.
The Issue Comparison Report provides an
analysis of a particular question, set of questions, section or
framework heading showing how each cohort within the target list
and the demographic questions cohort within the survey project.
It contains a single sheet and the comparisons
can be done either by rating or agree percentage.
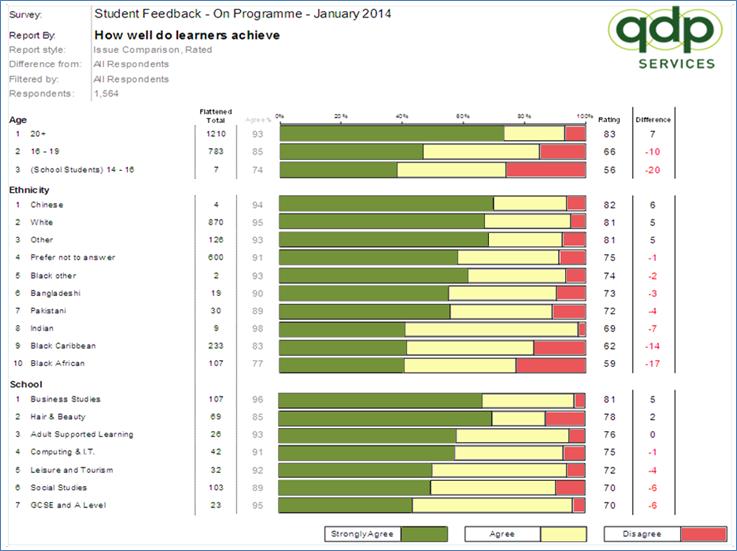

The headings of the Issue Comparison report
describe:
·
The title of the survey project.
·
The question, group of questions, section heading of framework
heading being analysed. (Report by) In the example the question
“How well do learners achieve”.
·
The report style is given for reference.
The left hand side of the report shows the
cohorts being compared. These are the demographics and/or the
columns from the target list. Within each question the
individual cohorts are ranked best to worst.
The graph down the centre shows the responses
to each of the cohorts. If you have used QDP’s standard
response scale the black will represent the strongly agrees, the
grey the agrees and the white will be all those who Disagree or
Disagree Completely.
If another response scale has been chosen the
black will usually represent the strongest positive, the grey all
other positives and the white the negatives. The graph also
excludes anyone who did not answer a particular issue.
A key to the graph is provided at the foot of
each page.
The total number included within the report is
shown at top of the report just under the headings.

The filtered by indicates whether those
included in the report have been restricted by a set of selection
criteria. For example the report may include only
males. In this case all respondents are included.
The calculated numbers from left to right
across the sheet are:
·
The flattened total – this is the number of respondents who
expressed an opinion for the particular cohort.
·
Agree % - Just to the left of the graph. This is the total number
people who gave a positive opinion expressed as a percentage of the
flattened total. On the graph this is the right hand end of
the grey bar. In the case of the first question this is
93%
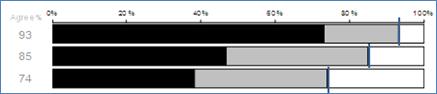
·
Rating – Just to the right of the graph is a weighted percentage
which provides a measure of the strength of agreement. A full
explanation is given in section 19.20 In terms of the above graph
it is calculated using the same data as the Agree % except each
person who only agreed is discounted by half. The calculation
is count each person who agreed strongly as 1, all those who agreed
as ½ and expressing this as a percentage of the flattened
total.
In terms of the
graph the value will be half the way along the grey.
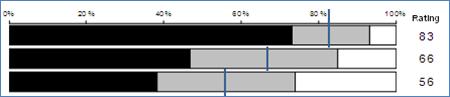
It can be seen
from the above example the rating value gives more differentiation
and thus provides better comparison.
·
Difference – is a comparison of the rating against the chosen
difference which is detailed in the title.
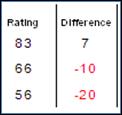
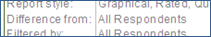
In this case the rating for all respondents is 76 and therefore the
difference for the three questions in the first section are 7, -10
and -20 respectively.
The summary for the section shows that for the first section this
course is 12 above the all respondent figure. The all respondent
summary rating is 74. The final sections question all fall
below the all respondent figure.
The Marketing Summary is produced when a
survey project includes a multiple choice question. The
report provides a summary of the results to these questions with
links to both pie and bar graphs should a more detailed view be
required.
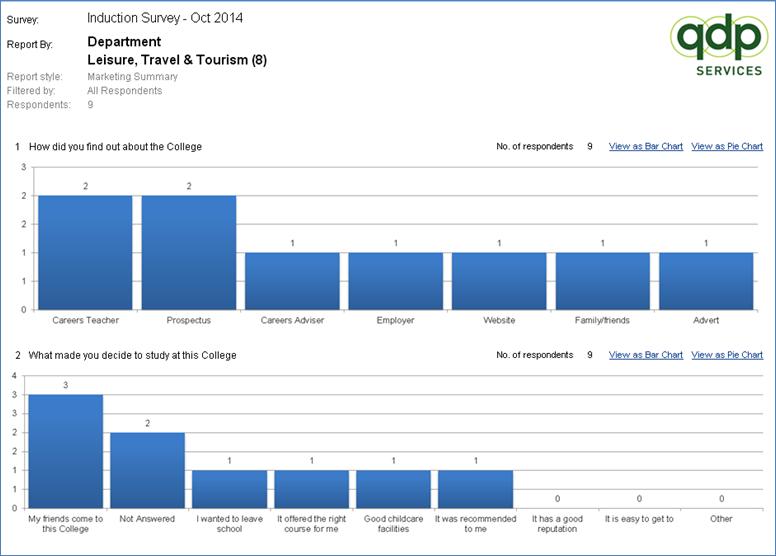
A bar chart is produced for each non rated
question normally ranked in order of number of responses from left
to right.

The headings of the Marketing Summary report
describe:
·
The title of the survey project.
·
The cohort being analysed. (Report by) In the example a Department
and Leisure, Travel & Tourism (8).
·
The report style is given for reference.
Your logo will be displayed on the left.
Each chart summarises the results for one of
the questions in the questionnaire and is headed by the question
text. To the left the total number of respondents to that
question is given together with links to a more detailed Bar and
Pie Chart.
The respondents included within the report are
detailed in the headings.

The Filtered by indicates which respondents
have been filtered into the report. In this case all
respondents within the chosen department which is a total of 9.
Each column of the bar also has the number of
the sample answering the particular response.
Note: If the question being analysed is a
multiple answer question then the total of all the respondents
shown against each response will be greater than the sample
size.
The chart itself shows each of the responses
using the number of respondents as the Y axis.
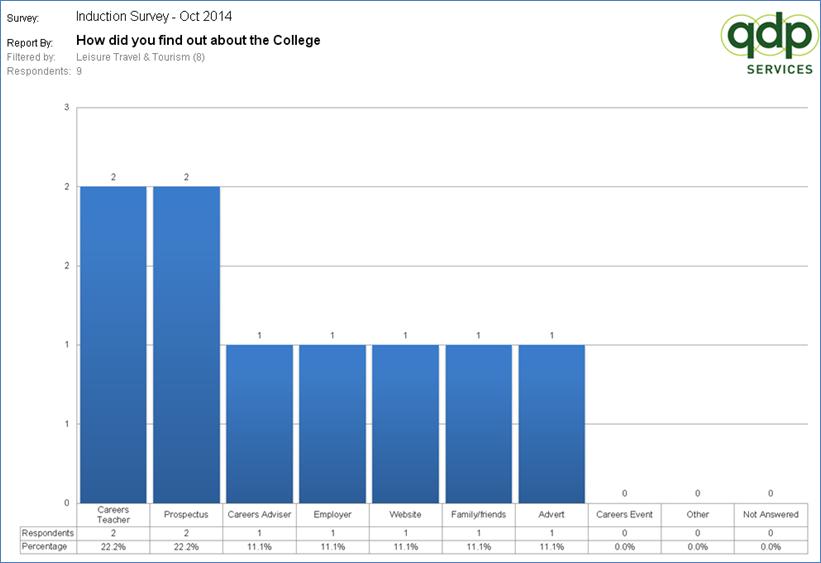
The bar chart is produced normally ranked in
order of number of responses from left to right for each question
included in the summary report.

The headings of the bar chart are:
·
The title of the survey project.
·
The question being analysed within the chart
·
Your logo will be displayed on the left.
The respondents included within the report are
detailed in the headings.

The Filtered by indicates which respondents
have been filtered into the report. In this case the Leisure,
Travel & Tourism department which is a total of 9.
Each column of the bar also has the numbers
and percentage of the sample answering the particular response…
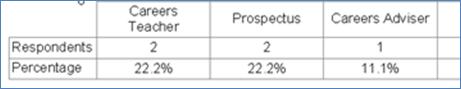
If the question being analysed is a multiple
answer question then the total of all the respondents shown against
each response will be greater than the sample size and the
percentages will add up to more than 100%.
The count for each of the columns is also
repeated above each column.
The chart itself shows each of the responses
using the number of respondents as the Y axis.
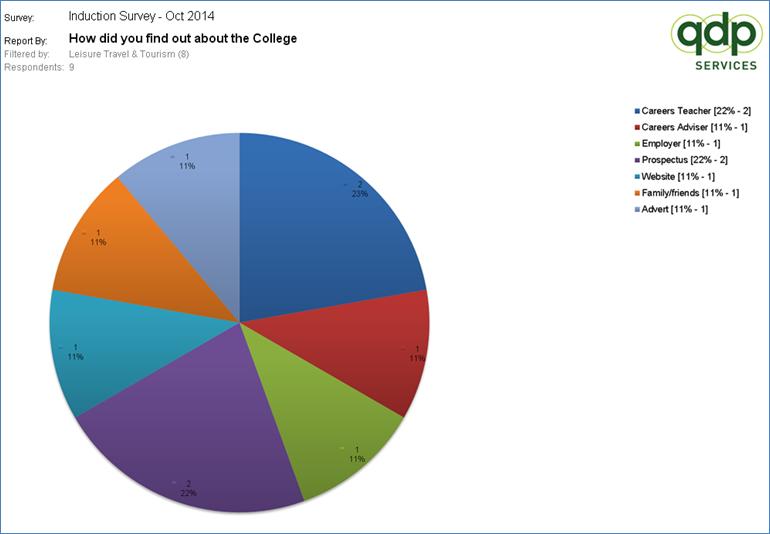
The pie chart is produced for most questions
which are not rated questions.

The headings of the pie chart are:
·
The title of the survey project.
·
The question being analysed within the chart. In this case
Outcome.
·
Your logo will be displayed on the left.
The respondents included within the
report are detailed in the headings.

The Filtered by indicates which respondents
have been filtered into the report. In this case everyone in
the Leisure, Travel & Tourism department which is a total of
9.
Each segment of the pie has the numbers and
percentage of the sample answering the particular response.
If the question being analysed is a multiple
answer question then the total of all the respondents shown against
each response will be greater than the sample size and the
percentages will add up to more than 100%.
The chart itself shows each of the responses
using the number of respondents as the segment size. A key is
also included detailing the response associated with each of the
segments.
A key is provided on the left.
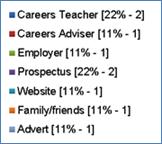
Employer surveys contain two additional sorts
of questions to other type of surveys. These are:
·
Question asking for help from the employer – such as “Would you be
prepared to provide Work Placement opportunities”. Two
additional reports are provided for these questions:
o Response
list report (See section 16.1) This list all those employers who
have agreed to provide support for a given question
o Response
Matrix Report (See section 16.2) This is similar to the above
but shows all the areas that an employer has agreed to help side by
side.
·
A “Would you recommend” question. This is analysed within a
Recommendation report. See section 16.3.
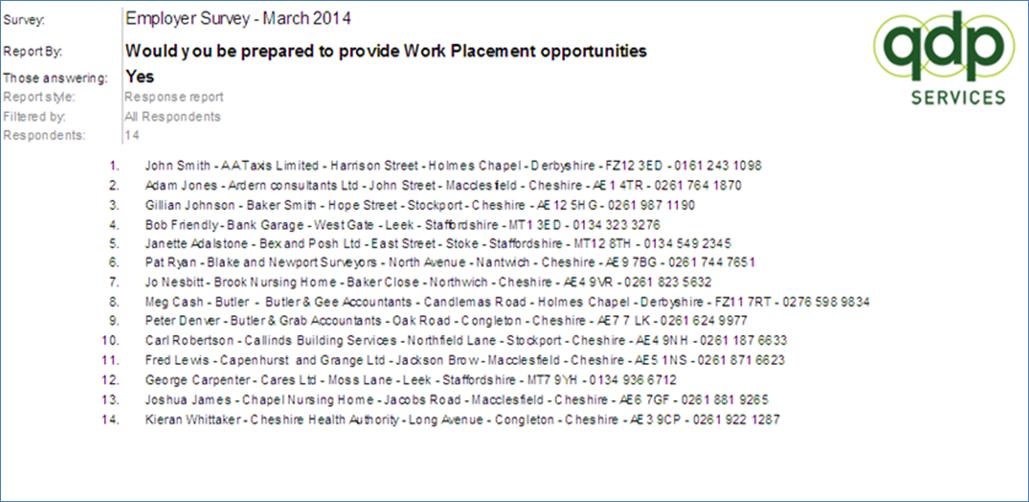
The Response Report lists the respondents and
some of their details of those who answered a particular response
to a given question. In our case those who answered Yes to
“Would you be prepared to provide Work Placement
Opportunities”. The details for each respondent taken from
the target list are the contact name, company name, company address
and phone number. The report is normally used to help marketing and
employer engagement within employer surveys.

The headings of the report are:
·
The title of the survey project.
·
The question being analysed (“Report by”)
·
The response to the question being analysed
·
Your logo will be displayed on the left.
·
The report style is given for information.
The respondents included within the
report are detailed in the headings.

The Filtered by indicates which respondents
have been filtered into the report. In this case all
respondents which who answered the question and response. In
this case 14.
The remainder of the report details the 14
employers who would provide work placements giving:
·
Contact name
·
Company Name
·
Company address
·
Company phone number
These details will vary depending on the data
supplied in the original target list.
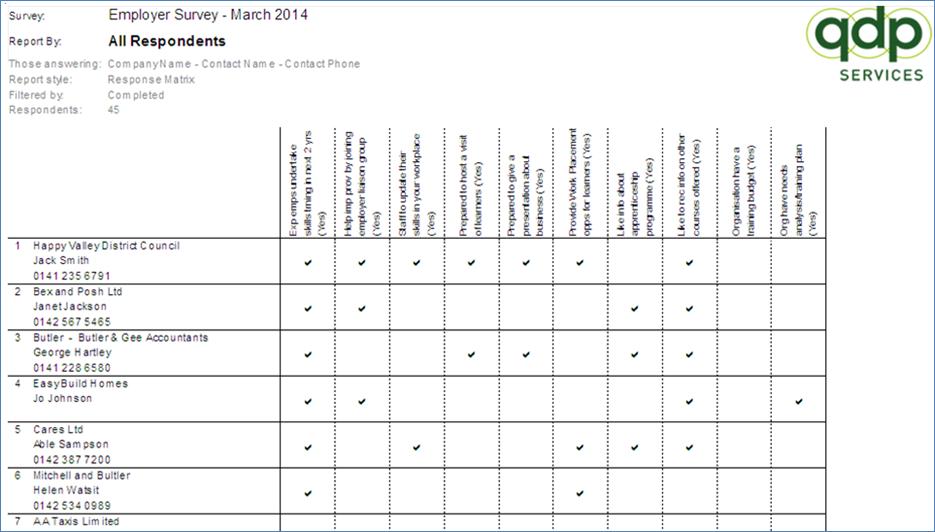
The Response Matrix lists the respondents and
some of their details of those who answered a particular response
to a given set of questions. In our case those who answered
yes to one of the requests for support questions within an employer
survey.

The headings of the report are:
·
The title of the survey project.
·
The cohort being analysed (“Report by”). In this case all
those answering one of the included questions.
·
The details of each respondent to be listed.
·
Your logo will be displayed on the left.
·
The report style is given for information.
The respondents included within the
report are detailed in the headings. The “Report by” is the
overall cohort – in our case all those answering one of the
included questions.

The Filtered by indicates which respondents
have been filtered into the report. In this case the report
is for a telephone survey and thus only completed calls have been
included. The total number included is shown - in this case
45.
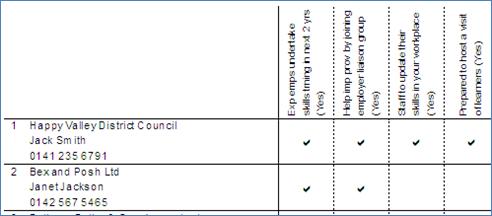
The remainder of the report shows each of the
employers on the left and give their company name, contact name and
telephone number.
The Columns are each of the questions and the
chosen response. Where the employer has selected the response
a tick appears.
The report makes it easy to contact employers
and discuss the help they have offered your organisation.
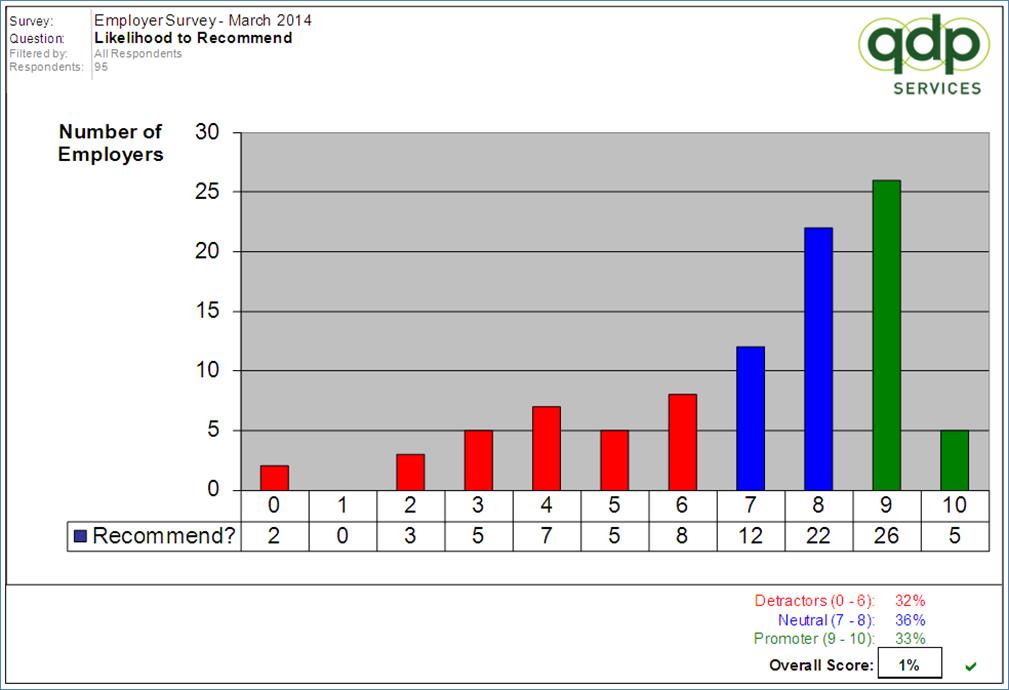
The Recommendation Report is based on the old
Training Quality Standard question. When respondents are
asked about the “likelihood to recommend” with an eleven point
response scale (0 to 10) this report will be produced.

The headings of the report are:
·
The title of the survey project.
·
The statement analyses which will always be “Likelihood to
Recommend”.
·
Your logo will be displayed on the left.
The respondents included within the
report are detailed in the headings. The “Filtered by” shows
the respondents to be included within the report. In this
case all respondents who have answered the question. The
number included is also given.

The graph shows the number of people answering
each of the eleven points (0 to 10) of the scale. The numbers
themselves are detailed below the graph.
The colour coding is used to indicate the:
·
Detractors – shown in red. These are the respondents that
score your organisation 6 or less.
·
Neutral – shown in blue. The respondents that scored your
organisation 7 or 8.
·
Promoters – shown in green. These scored your organisation
either 9 or 10.
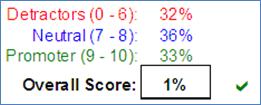
At the bottom right hand side of the graph is
a calculated score. In our case this 1%. It is worked
out by calculating the percentage of each of the detractors,
neutral and promoters. The final score is Promoters –
Detractors. The neutrals are ignored. If the overall
score is positive a green tick is displayed.
The scoring may at first sight seem a little
harsh people as a whole always express a positive opinion and thus
skew the sample positive. The scoring systems corrects for
this skew.
The details of those answering as detractors,
neutral and promoters can be found on three sheets within the
workbook accessed either using the tabs at the bottom or by
clicking the appropriate score. An example is given
below.
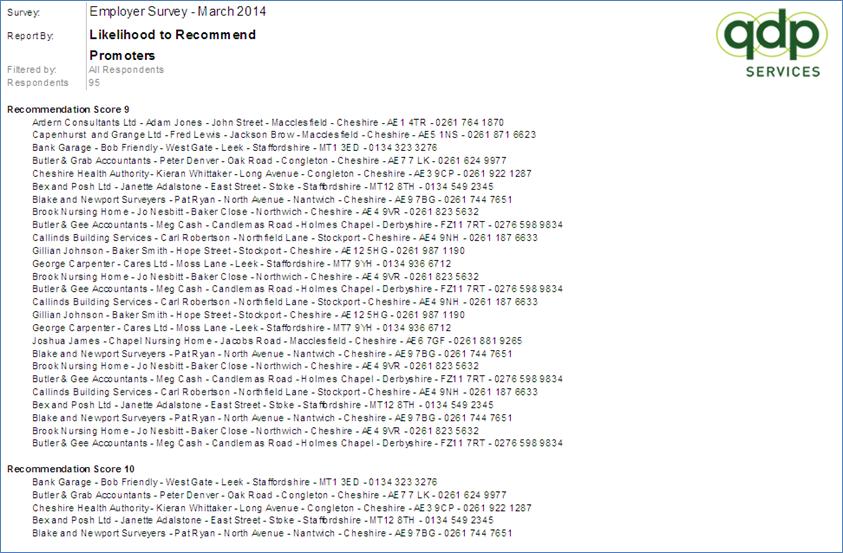
The Management Summary report is designed to
give an overview of your organisation or a particular part of
it. The example used gives a comparison of the top level of
our organisation, division. The report attempts to draw out the
issues using seven different comparators each of which is explained
in the appropriate section
The seven comparators are:
·
Return Rates and Overall Satisfaction levels.
·
A comparison of the overall performance of the top or next level of
the organisation
·
A comparison of the performance of the next level of the
organisation using individual statements.
·
A comparison of the demographics performance against the key
statements.
·
An external comparison between your learners and the appropriate
QDP benchmark.
·
A comparison between your organisation and similar providers.
·
Details of the statements showing the most and least improvement
across your organisation.
The report can be generated using either
ratings or agree percentages for the comparison.
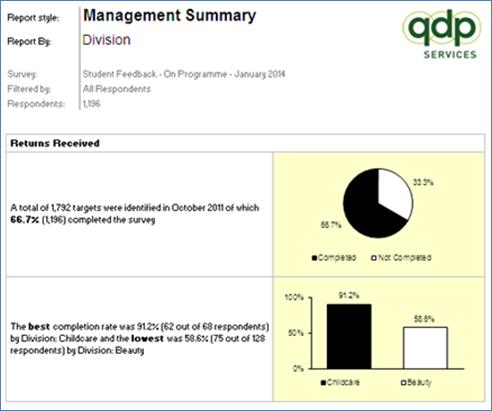
The headings of the report describe:
·
The title of the survey project.
·
The level of the organisation being compared. In our example
the divisions within the College.
·
Any filtering applied to the data being used. For example the
report could be produced for each division comparing the
departments within it. The filter would be the appropriate
division.
·
The number of respondents analysed within the report.
·
Your logo will be displayed on the left.
The page is split into two. The top
section shows the return rate for the overall survey in the form of
a pie chart. Beneath this the bar chart shows the best and
worst returns for the next level down within the organisation
structure. Our example college is first managed in
divisions.
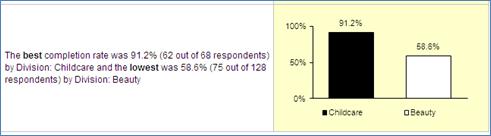
Childcare achieved the highest response rate
of 91.2% with Beauty only achieving 58.6%
NOTE: Return rates can only be provided where
target numbers have been provided.
The lower half of the report provides an
analysis of the satisfaction with both the organisation and the
course. This is given in terms of an Agreement percentage pie
chart for the appropriate questions.
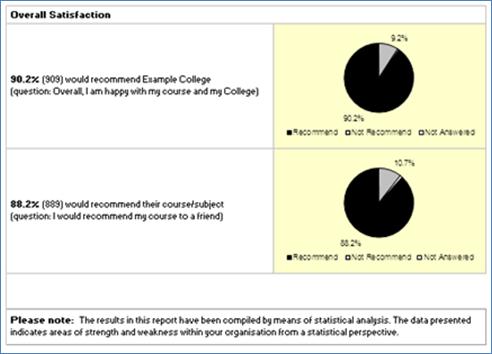
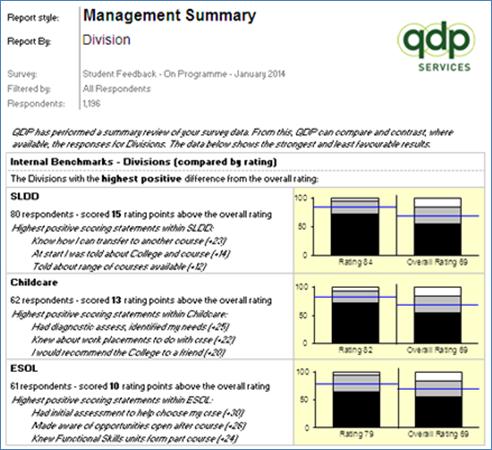
This report shows the strongest and weakest
performing areas at the chosen level. This is calculated by
creating an overall score for each of the areas within the chosen
level of the organisation, in this case Division. The score is
simply an aggregate of every opinion expressed for every question
for each of the divisions.
The top half of the page, seen opposite, shows
the 3 top scoring divisions within the organisation and the bottom
half the three lowest scoring divisions.
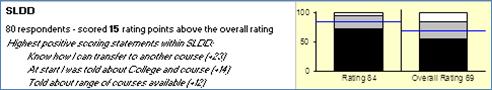
Each division is reported as above. The
division name is given followed by the number of respondents within
the division and the number of rating points the division scores
above the average. (In the example above SLDD scored 15
rating points above the average.)
The three statements which scored highest
compared to the average scores for that statement across the survey
are also given. Each question is compared individually
against the average score for the question.
The graph on the far right shows the results
for survey. The black shows the strongly agrees, the grey the
agrees and white the Disagrees. The line is the average score
for all the questions within the survey.
The graph on the left shows the same results
for this division.
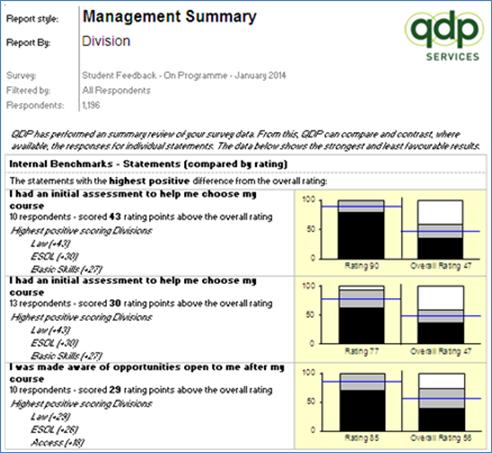
This report shows the strongest and weakest
performing areas using a single statement to perform the
comparison. This is calculated using the overall score for
each statement as the benchmark and then checking the difference
from that benchmark for each of the areas of the organisation at
the chosen level.
The top half of the page, seen opposite, shows
the 3 top scoring statements within the organisation and the bottom
half the three lowest scoring statements.
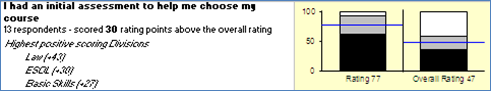
Each statement is reported as above. The
statement is given followed by the number of respondents within the
division for the question and the number of rating points the
division scored above the average for that question within the
survey. (In the example above Law scored 30 rating points
above the average.)
Underneath the statement the three divisions
which scored highest compared to the average score for that
statement across the survey are also given. Each question is
compared individually against the average score for the
question.
Note: A statement can occur twice in the top 3
when 2 divisions produce the high differences as in our
example. Law scored +43 and ESOL scored +30 which were the
highest differences within all the question/ division
combinations.
The graph on the far right shows the result
for that statement for the survey. The black shows the
strongly agrees, the grey the agrees and white the Disagrees.
The line is the average score for all the respondents within the
survey.
The graph on the left shows the same results
for the division for the identified statement.
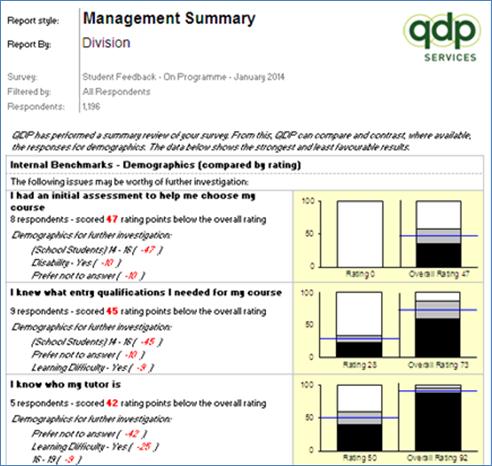
This report shows the strongest and weakest
performing areas using a single statement to perform the
comparison. This is calculated using the overall score for
each statement as the benchmark and then checking the difference
from that benchmark for each of the areas of the organisation at
the chosen level.
The top half of the page, shown opposite gives
the 3 top scoring statements within the organisation and the bottom
half the three lowest scoring statements.
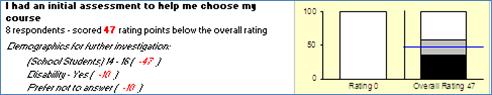
Each statement is reported as above. The
statement is given followed by the number of respondents within the
demographic for the question and the number of rating points the
demographic scored above the average for that question within the
survey. (In the example above School Students scored 47
rating points above the average.)
Underneath the statement the three
demographics which scored highest compared to the average score for
that statement across the survey are given. Each question is
compared individually against the average score for the
question.
Note: A statement can occur twice in the top 3
when 2 demographics produce the high differences as in our
example.
The graph on the far right shows the result
for that statement for the survey. The black shows the
strongly agrees, the grey the agrees and white the Disagrees.
The line is the average score for all the respondents within the
survey.
The graph on the left shows the same results
for the demographic for the identified statement.
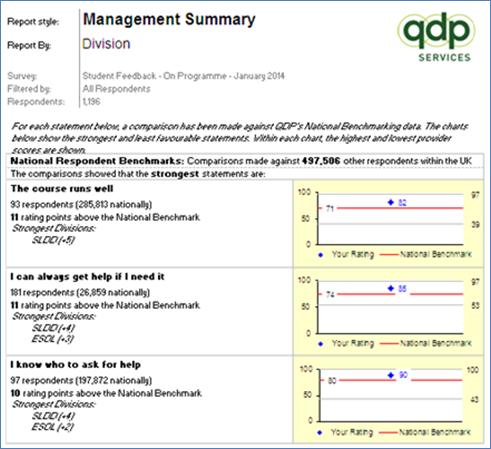
This report shows the strongest and weakest
performing areas of the organisation, in this case the divisions,
using a single statement to perform the comparison. This is
calculated using QDP’s National Respondents Benchmark score for
each statement as the benchmark and then checking the difference
from that benchmark for each of the areas of the organisation.
The top half of the page, shown opposite,
gives the two top scoring statements within the organisation and
the bottom half the two lowest scoring statements.
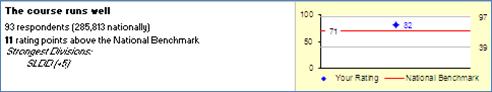
Each statement is reported as above. The
statement is given followed by the number of respondents for the
question within the division, the number of respondents in QDP’s
benchmark and the number of rating points the division scored above
QDP’s benchmark. (In the example above SLDD scored 5 rating
points above the national average.)
Underneath the statement up to three divisions
which scored highest compared to the national average score for
that statement are given. Each question/ division combination
is compared individually against QDP’s National Benchmark.
The graph shows QDP’s National Benchmark
figure – the red line and divisions score – the blue diamond.
NOTE: The National Respondents Benchmark
is calculated taking each individual view without any aggregation
being undertaken. For the selected statement 285,813
respondents expressed a view.
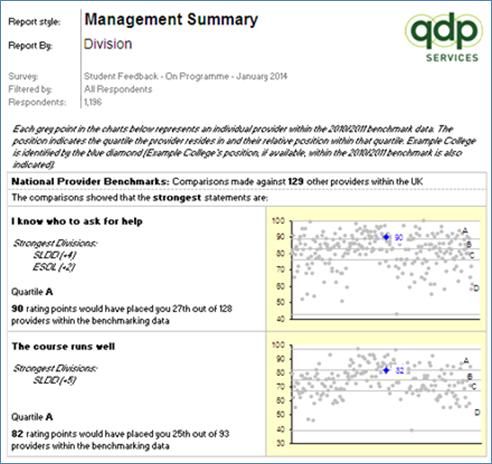
This report shows the strongest and weakest
performing areas of the organisation, in this case the divisions,
using a single statement to perform the comparison. This is
calculated using QDP’s National Provider Benchmark score for each
statement as the benchmark and then checking the difference from
that benchmark for each of the areas of the organisation.
The top half of the page, shown opposite,
details the two top scoring statements within the organisation and
the bottom half the two lowest scoring statements.
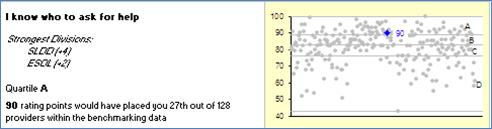
Each statement is reported as above. The
statement is given followed by the score of the up to highest three
divisions, the quartile the highest division would fall within.
Underneath the statement up to three divisions
which scored highest compared to the national average score for
that statement are given. Each question/ division combination
is compared individually against QDP’s National Benchmark.
The final paragraph details where the division
would fall in terms of the providers. (In the example above
SLDD scored 90, 4 rating points above the national average which if
it was the sole division in the organisation would place it
27th out of the 128 organisations within the
benchmark.)
The graph shows QDP’s National Benchmark
figures. The boundaries between the 4 quartiles are shown as
grey lines with the appropriate quartiles indicated. The grey
dots show the score for each of the organisations within the
Provider Benchmark pot. The blue diamond shows where the
division would fall.
NOTE: The National Provider Benchmark is
calculated taking each individual view and aggregating them for
each provider to form a single score. These provider scores
are then used to calculate the benchmark. For the selected
statement 128 providers are included.
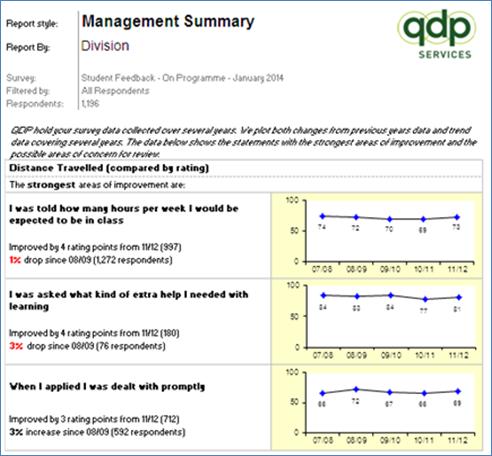
This report shows the strongest and weakest
performing statements used within the survey for the
organisation. The strongest and weakest performing areas are
chosen using the distance travelled from the previous year.
The top half of the page show opposite is the
three statements with the strongest distance travelled this
year.
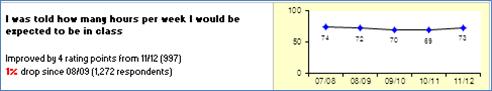
Each statement is reported as above. The
statement is given followed by the distance travelled from last
year and the distance travelled over the last five years if
available. The number of respondents within last year sample
and the sample of the first survey used are also given.
The graph shows the distance travelled in the
form of a simple line graph.
This is repeated for the areas of concern on
the lower half of the page.
The Graphical Report provides an easy to read
analysis of the results for any cohort within the survey
project. The results are shown for each rated question within
the survey in 3 different ways:
·
As a graph. The black shows the most positive respondents,
the grey all other positive respondents and the white all those
that negative.
·
The raw data which details the respondents to each rated
question
·
A comparison of each question against the results for all the
respondents to the survey or against a chosen cohort.
Within QDP’s default report set a
graphical report will be produced for each cohort targeted and for
each cohort within the demographics.
Each report contains 2 sheets:
·
The Report Sheet (Section 9.1)
·
The Demographics Sheet (Section 9.2)
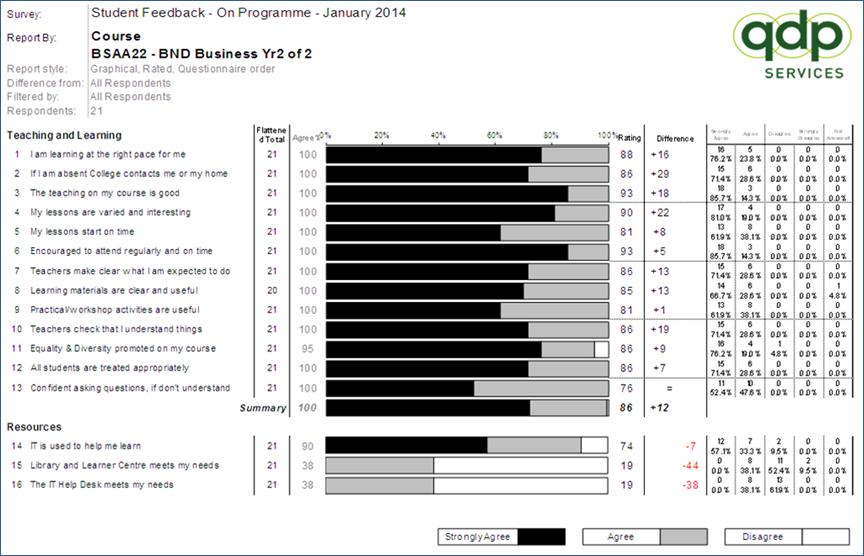
The Report Sheet provides an easy to read
analysis of the results for any cohort within the survey project.
It is split into 4 sections:
·
The headings
·
The questions
·
The graph
·
The data
17.2.1.1 Headings

The headings of the graphical report
describe:
·
The title of the survey project.
·
The cohort being analysed. (Report by) In the example a course and
in particular BSAA22 - BND Business Yr2 of 2.
·
The report style is given for reference. Obviously a
Graphical Report but, in addition in this example the questions are
output in questionnaire order. They can also be produced using a
relevant inspection or other framework.
·
Your logo will be displayed on the left.
17.2.1.2 Questions
The questions chosen to be included in the
reports are shown on the left. The questions can either be
analysed using the sections and order in questionnaire or using an
inspection or other relevant framework.
17.2.1.3 Graph
The graph down the centre shows the responses
to each of the questions. If you have used QDP’s standard
response scale the black will represent the strongly agrees, the
grey the agrees and the white will be all those who Disagree or
Disagree Completely.
If another response scale has been chosen the
black will usually represent the strongest positive, the grey all
other positives and the white the negatives.
The graph also excludes anyone who did not
answer a particular issue.
A key to the graph is provided at the foot of
each page or at the foot of each section if the scale being used
changes from section to section
17.2.1.4 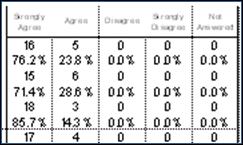 Data
Data
The data used within the report is shown on
the right of the report. These are the counts of those
answering each particular response, Strongly Agree to Strongly
Disagree. The Not Answered is those that chose not to express
an opinion either by choosing not applicable or by not selecting a
response at all.
The total number included within the report is
shown at top of the report just under the headings.

The Filtered by indicates whether those
included in the report have been restricted by a set of selection
criteria. For example the report may include only
males. In this case All Respondents are included.
17.2.1.5 Calculated
Numbers
Working from left to right, from data the
following are calculated:
·
The flattened total – this is the number of respondents who
expressed an opinion. This is everyone who answered the
particular question excluding those who answered not
applicable.

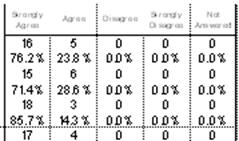
If one of the
totals is lower than the others it may indicate a question has been
poorly understood. Note: if you have used multiple
questionnaires in a survey project and a given question has only be
asked if one of them this may also cause lower response rates.
·
Agree % - Just to the left of the graph. This is the total number
people who gave a positive opinion expressed as a percentage of the
flattened total. On the graph this is the right hand end of
the grey bar. In the case of the first question this is
100%

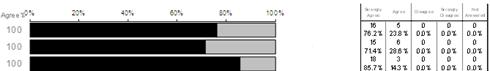
·
Rating – Just to the right of the graph is a weighted percentage
which provides a measure of the strength of agreement. A full
explanation is given in section 19.20 In terms of the above graph
it is calculated using the same data as the Agree % except each
person who only agreed is discounted by half. The calculation
is count each person who agreed strongly as 1, all those who agreed
as ½ and expressing this as a percentage of the flattened total. In
this case for the first question the rate is 16 + (5 *0.5) divided
by 21. Which is 18.5/21 or 88
In terms of the
graph the value will be half the way along the grey.


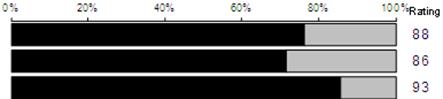
It can be seen
from the above example the rating value gives more differentiation
and thus provides better comparison.
·
Difference – is a comparison of the rating against the chosen
difference which is detailed in the title.
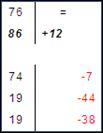
In this case for the last question of the first section the rating
is 76 for this course which is equal to the chosen comparator; all
those expressed an opinion for the question in the survey.
The summary for the section shows that for the first section this
course is 12 above the all respondent figure. The all respondent
summary rating is 74. The final sections question all fall
below the all respondent figure.
·
Summary – this line at the foot of each section is a summary of the
above questions scores. This is not an average of the above
it is calculated from each individual value from scratch.
Similarly the difference is calculated using the raw data not
averaging the figures displayed. This is done to ensure that
poorly answered questions do not distort the summary figure.
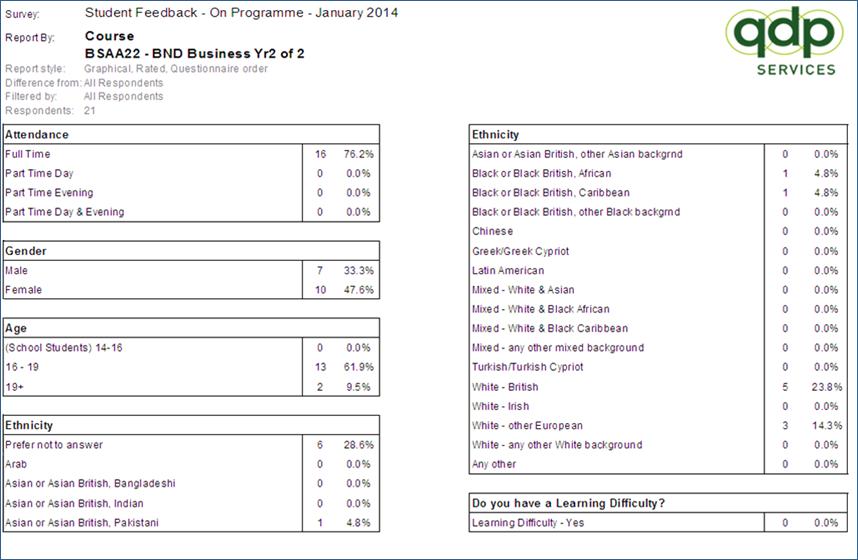
The Demographics Sheet details how the
respondents within the report are split in terms of their
demographics. For example, age, ethnicity and gender.
17.2.2.1 Headings
The headings are a repeat of those on the
Report Sheet. See section Error!
Reference source not found..
17.2.2.2 Questions
The questions included are those identified as
being demographics within the questionnaire and the target
list. The identification is done by QDP Matrix number.
17.2.2.3 Data
For each demographic the respondents are
broken down. The number and the percentage of the total
sample within the report are shown.
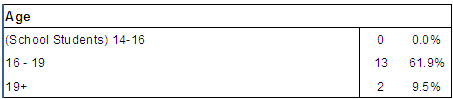
You will notice that for the Age demographic a
total of 15 are split down. The total number in the report,
shown at the top of the page, is 21. This indicates 6 people
did not select an age when completing the questionnaire.
The Graphical Report with External
Benchmarking provides an easy to read graph of the results with a
detailed external comparison for any cohort where QDP hold a
relevant benchmark.
It can contain up to 6 sheets:
·
Error! Reference source not found.
(Error! Reference source not
found.)
·
Error! Reference source not found.
(Section Error! Reference source not
found.)
·
Strengths and Weaknesses (Section 10.3)
·
Error! Reference source not found.
(Section Error! Reference source not
found.)
·
Error! Reference source not found.
(Section Error! Reference source not
found.)
·
Error! Reference source not found.
(SectionError! Reference source not
found.)
·
Stats Sheet (Section Error! Reference source
not found.)
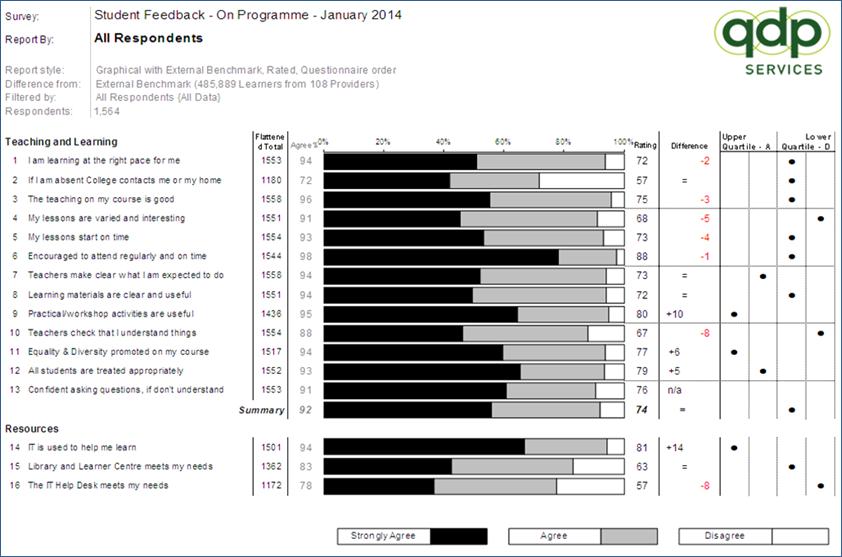
The Report Sheet provides an easy to read
analysis of the results for any cohort within the survey project.
The left hand side of the graph shows an external benchmark for
each statement within the report.
17.3.1.1 Headings

The headings of the graphical report
describe:
·
The title of the survey project.
·
The cohort being analysed. (Report by) In the example all
respondents to the survey project.
·
The report style is given for reference. In addition in this
example the questions are output in questionnaire order. They can
also be produced using a relevant inspection or other
framework.
·
Your logo will be displayed on the left.
17.3.1.2 Questions
The questions chosen to be included in the
reports are shown on the left. The questions can either be
analysed using the sections and order in questionnaire or using an
inspection or other relevant framework.
17.3.1.3 Graph
The graph down the centre shows the responses
to each of the questions. If you have used QDP’s standard
response scale the black will represent the strongly agrees, the
grey the agrees and the white will be all those who Disagree or
Disagree Completely.
If another response scale has been chosen the
black will usually represent the strongest positive, the grey all
other positives and the white the negatives.
The graph also excludes anyone who did not
answer a particular issue.
A key to the graph is provided at the foot of
each page or at the foot of each section if the scale being used
changes from section to section
17.3.1.4 Data
The data used within the report is included as
a separate sheet accessible by clicking the appropriate tab at the
foot of the screen. The data sheet is described in section
Error! Reference
source not found..
The total number included within the report is
shown at top of the report just under the headings.

The filtered by indicates whether those
included in the report have been restricted by a set of selection
criteria. For example the report may include only
males. In this case all respondents are included.
The “{All Data}” indicates the benchmark being
used. This is described in section Error! Reference source not
found..
17.3.1.5 Calculated
Numbers
Working from left to right, from data the
following are calculated:
·
The flattened total – this is the number of respondents who
expressed an opinion. This is everyone who answered the
particular question excluding those who answered not
applicable.
If one of the
totals is lower than the others it may indicate a question has been
poorly understood. Note: if you have used multiple
questionnaires
in a survey
project and a given question has only be asked if one of them this
may also cause lower response rates. You can check the
questionnaires used and the mappings made on the Questionnaire
sheet accessible by the clicking the appropriate tab at the foot of
the screen and described in section Error! Reference source not
found..
·
Agree % - Just to the left of the graph. This is the total number
people who gave a positive opinion expressed as a percentage of the
flattened total. On the graph this is the right hand end of
the grey bar. In the case of the first question this is
94%
·
Rating – Just to the right of the graph is a weighted percentage
which provides a measure of the strength of agreement. A full
explanation is given in section 19.20 In terms of the above graph
it is calculated using the same data as the Agree % except each
person who only agreed is discounted by half. The calculation
is count each person who agreed strongly as 1, all those who agreed
as ½ and express this as a percentage of the flattened total. In
this case for the first question the rate is 791 + (664 *0.5)
divided by 1553. Which is 1123/1553 or 72.3 or 72%
In terms of the
graph the value will be half the way along the grey.
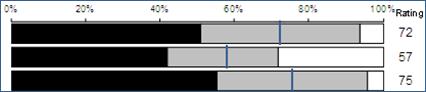
It can be seen
from the above example the rating value gives more differentiation
and thus provides better comparison.
The Summary line
at the foot of each section is a summary of the above questions
scores. This is not an average of the above it is calculated
from each individual value from scratch. Similarly the
difference is calculated using the raw data not averaging the
figures displayed. This is done to ensure that poorly
answered questions do not distort the summary figure.
17.3.1.6 External
Benchmarks
The benchmark used within the report is
selected using three pieces of information:
·
Your provider type. For example college or 6th
form college or primary school.
·
The cohort being analysed. For example a given sector subject
area or gender. In this case it is all respondents.
·
If multiple benchmarks are available given the above 2 have been
applied each one of the benchmarks will produce a separate
report. The is identified under the Filtered by in the
headings. In this case “{All data}” indicating the
benchmark has not been narrowed further.
The multiple benchmarks for a given cohort
normally only occur when analysing All respondents. Most
customers provide QDP with a set of criteria which are used to
create benchmarks. Examples of the criteria are:
·
Inspection grade
·
Location e.g. Rural, Town, City Centre
·
Size
The benchmark itself is expressed in 2
ways. First as a difference from the views of the learners
who have expressed an opinion.
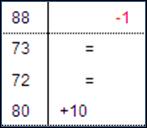 The rating are used as the
comparison. In the example on the left the top statement has
a rating of 88 for this cohort which is 1 below QDP’s national
benchmark for the statement and cohort. The middle two statements
match QDP average and the last is 10 above.
The rating are used as the
comparison. In the example on the left the top statement has
a rating of 88 for this cohort which is 1 below QDP’s national
benchmark for the statement and cohort. The middle two statements
match QDP average and the last is 10 above.
If a benchmark is not available for the
statement “n/a” will be printed.
The difference counts each individual person
answers separately and therefore in this example counts each of the
surveys 1,564 respondents and compares them to the 485,889
respondents held in QDP’s national benchmark.

The second way of expressing the benchmark is
to count each individual establishment separately. This
comparison is in the form of quartiles and is shown on the right of
the graph. In our example this compares your average score
against the 108 average provider scores held by QDP.
The provider benchmark is expressed in
quartiles, A to D with A being the best.

Taking the four questions used above the
quartiles are:
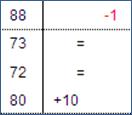
NOTE: In most cases the learner benchmark will
be reflected in the provider quartile however large institutions
with large surveys can cause the respondent benchmark to be skewed
slightly and therefore it is possible to have a positive learner
benchmark and yet fall into a c or D quartile and visa verse.
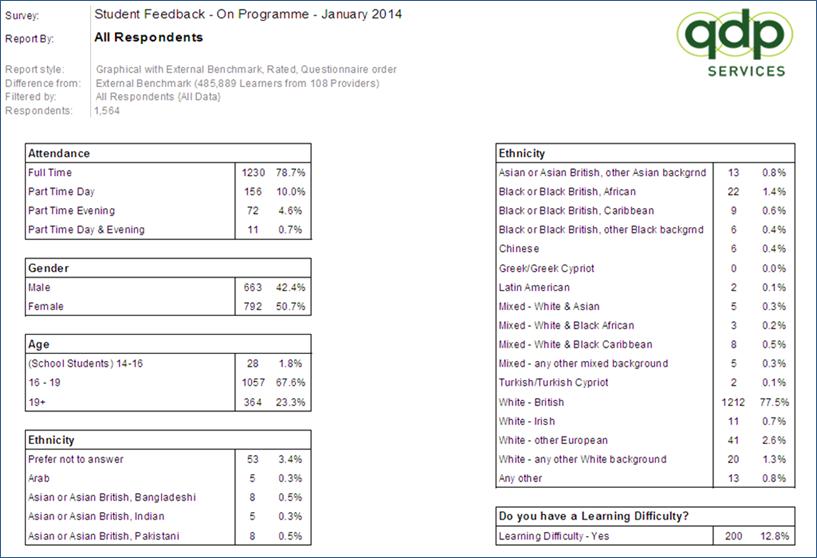
The Demographics Sheet details how the
respondents within the report are split in terms of their
demographics.
17.3.2.1 Headings
The headings are a repeat of those on the
Report Sheet. See section Error!
Reference source not found.Error!
Reference source not found..
17.3.2.2 Questions
The questions included are those identified as
being demographics within the questionnaire and the target
list. The identification is done by QDP Matrix number.
17.3.2.3 Data
For each demographic the respondents are
broken down. The number and the percentage of the total
sample within the report are shown.
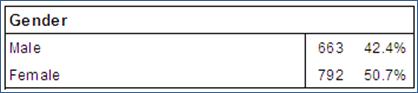
You will notice that for the Gender
demographic the percentages do not add up to 100%. A total of
1,455 respondents genders are split down. The total number in
the report, shown at the top of the page, is 1,564. This
indicates 109 people did not supply their Gender.
The other questions shows the split of the
results for questions that are neither rated nor
demographics. For example marketing questions such as How did
you find out about the College.
The layout and content of the other questions
sheet is exactly the same as that of the demographics sheet
described opposite.
The contributors sheet can be accessed from
the tabs at the foot of the screen and lists all those
organisations providing data for the benchmark pot for this
particular report.
17.3.4.1 Headings
The headings are a repeat of those on the
Report Sheet. See section Error!
Reference source not found.Error!
Reference source not found..
17.3.4.2 Contributors
The contributors are listed in alphabetical
order in 3 columns. Your own organisation will be included
and shown in bold. In this case QDP Example College.
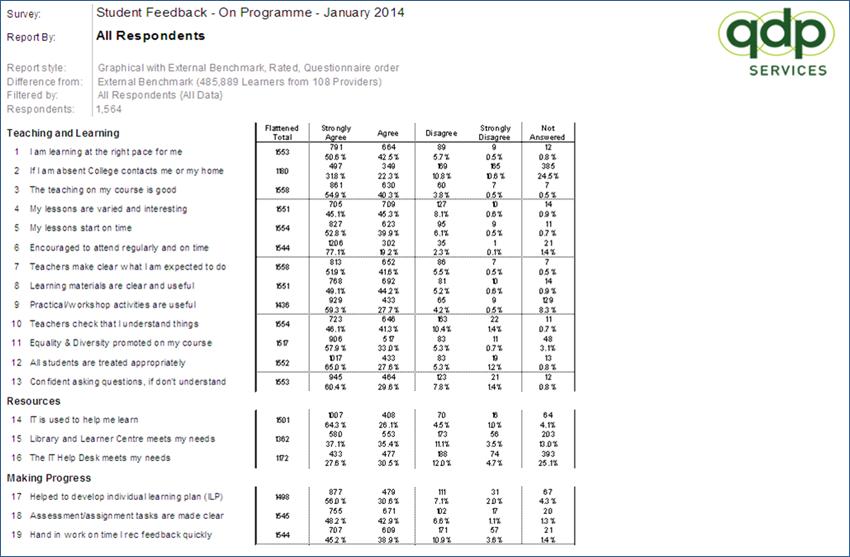
The raw data sheet can be accessed from the
tabs at the foot of the screen and details the answers given to
each question within the report.
17.3.5.1 Headings
The headings are a repeat of those on the
Report Sheet. See section Error!
Reference source not found.Error!
Reference source not found..
17.3.5.2 Questions
The questions chosen to be included in the
reports are shown on the left. The questions can either be
analysed using the sections and order in questionnaire or using an
inspection or other relevant framework.
17.3.5.3 Data
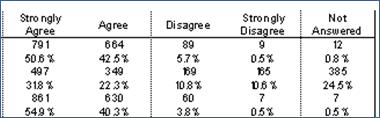
These are the counts of those answering each
particular response, Strongly Agree to Strongly Disagree. The
Not Answered is those that chose not to express an opinion either
by choosing not applicable or by not selecting a response at
all.
The total number included within the report is
shown at top of the report just under the headings.

The filtered by indicates whether those
included in the report have been restricted by a set of selection
criteria. For example the report may include only
males. In this case all respondents are included.
17.3.5.4 Calculated
Numbers
The flattened total – this is the number of
respondents who expressed an opinion. This is everyone who
answered the particular question excluding those who answered not
applicable.

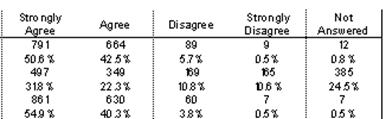
If one of the totals is lower than the others
it may indicate a question has been poorly understood. Note:
if you have used multiple questionnaires in a survey project and a
given question has only be asked if one of them this will also
cause lower response rates.
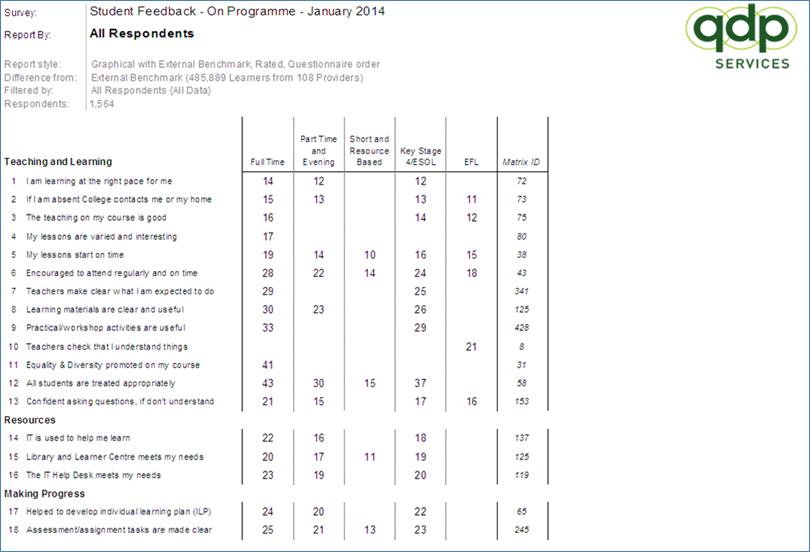
The questionnaire usage sheet will only be
included when more than on questionnaire model has been included
within a survey project. In our example five questionnaire
models have been used in the On Programme survey to target the
various learner types within the organisation.
17.3.6.1 Headings
The headings are a repeat of those on the
Report Sheet. See section Error!
Reference source not found.
17.3.6.2 Questions
The questions chosen to be included in the
reports are shown on the left. The questions can either be
analysed using the sections and order in questionnaire or using an
inspection or other relevant framework.
17.3.6.3 Questionnaires
The columns of the report show where each of
the questions on the left appeared in the appropriate
questionnaire.
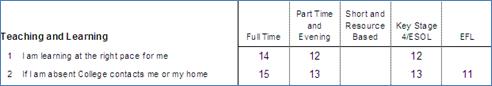
Our example shows that question 2 – If I
am absent College contacts me or my home was asked in 4 or the 5
questionnaire and the in the Full Time questionnaire it was
question number 15, in the Part Time and Evening it was question 13
and so on.
17.3.6.4 Matrix ID
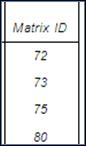 The final column on the right
shows which QDP matrix question the statement is mapped
against.
The final column on the right
shows which QDP matrix question the statement is mapped
against.
This will be used to benchmark question within
the report sheet.
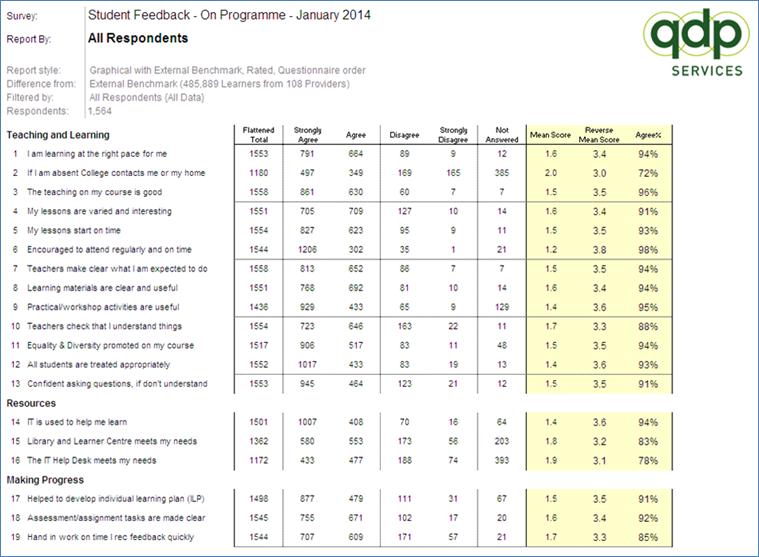
The stats sheet shows the answers given to
each question along with 4 additional calculated values:
·
Flattened total – the number of people who expressed an
opinion. In other words it excludes all those who did not
answer the question or ticked not applicable.
·
Mean score – this is the average of the responses to the
question. It is calculated by numbering the responses from 1
upwards and from left to right, multiplying these response numbers
by the number answering the response and dividing by total number
answering.
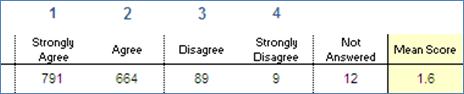
The above example
is calculated as follows:
Strongly Agree 791
* 1 = 791
Agree
664 * 2 = 1,328
Disagree
89 * 3 = 267
Strongly Disagree 9 * 4 = 36
Total
2,422
Divide this by the
total number answering 1,553. This gives 1.559 which rounded
is 1.6.
·
Reverse mean score – this is calculated as the mean score but
numbering the responses from right to left. The calculation
is the same as above using the new response numbers.
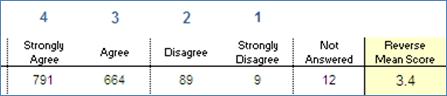
·
Agree Percentage – calculated by taking all those agree with a
statement and dividing by the number of people expressing an
opinion.
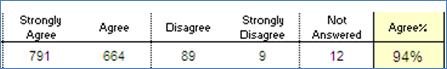
·
In the above example add the Strongly Agree and Agree, 791 + 664 =
1,455 and dividing by those expressing an opinion. 1,455 / 1,553
and express it as a percentage. This gives 93.689 which round
to 94%.
The All Returns Report shows the returns
received for the survey project broken down by the cohorts
identified within the target list.
It contains a single sheet.
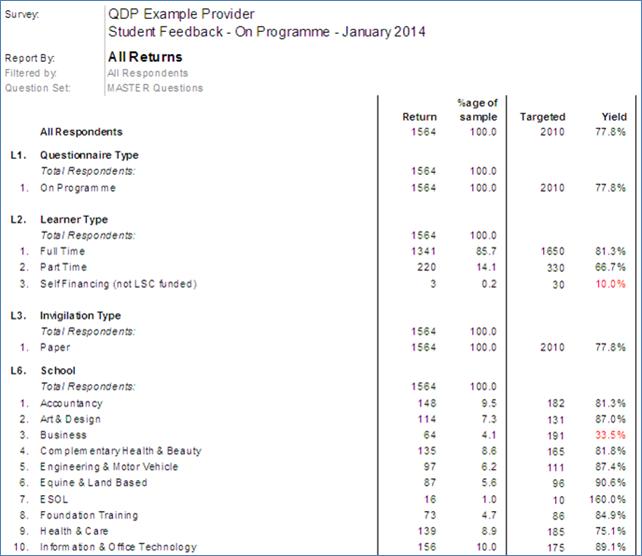
The Report Sheet provides an easy to read
analysis of the results for any cohort within the survey
project.

The headings of the all returns report
are:
·
Your organisation name
·
The title of the survey project.
·
The cohort being analysed. (Report by)
·
The respondents can be reduced by filtering in various
cohorts. For example it can be produced by all those
completing questionnaires on paper.
·
The report can also be narrowed by a particular questionnaire
within the survey project. (Question Set) In this example the
master question set has been chosen which will include
everyone.
·
Your logo will be displayed on the left.

The following data is shown for each cohort
including all respondents.
·
Return – the number completing the survey
·
% age of sample. For example the full time return is 1341
which is 85.7% of the total return of 1564
·
Targeted - in most cases this will show the number targeted for the
cohort. In some cases, for example where an open
questionnaire has been used the number targeted will not be
known.
·
Yield – if the target number is known this will give the %age who
have completed the questionnaire. In the above example 1564 have
completed the survey out of 2010 which is a yield of 77.8%
The total number of people who agreed
(Strongly Agree and Agree) with a statement expressed as a
percentage of the total number of people expressing an opinion of
that statement (the Flattened total) QDP recommend this figure is
used when communicating with external bodies. E.g. the media
The Agree % can be used for quality
improvement but, it is more difficult to use to measure improvement
than the rating.
Definition:
All those who
agreed divided by all those who expressed an opinion.
Normally count of (those who Strongly Agree or Agree) /Flattened
total) * 100
The benchmark described in the heading and
shown on the right of the report is the chosen 'slice' to which all
the chosen 'slices' to Report by are compared.
For example you could choose to compare the
courses within a Curriculum Area. The Report by would
be Course and the Curriculum Area would be the Benchmark.
Courses with positive black scores are higher
than the appropriate Curriculum Area and those with red scores are
lower.
This is the comparator for the report and
shows how well the chosen 'slice' of data compares. For example the
comparison maybe against:
·
All respondents answering the survey or
·
the next level up the management structure (e.g. a course against a
curriculum area) or
·
an external QDP benchmark figure (e.g. Full time learners) In this
case the number of respondents and organisation within the
benchmark will also be shown
The comparison is shown for each issue in the
'Difference' column usually just to the right of the graph.
This indicates the gap between the score for
this 'slice' when compared to the score for the chosen Difference
from shown at the head of the report.
It is a comparison of the performance of the
chosen 'slice' against the chosen Difference from or benchmark.
The black positive figures indicate better
than benchmark performance, whereas the negative red figures
indicate poorer performance.
A full description of the Distance Travelled
Report is available within the Understanding Reports section.
The report is produced once the survey has been run more than once
for each area of the school you targeted and for each demographic
included within the survey. The comparison can span up to 5
runs of a given survey.
The Distance Travelled Report is useful to
confirm the areas identified and addressed from the last survey
have indeed improved. Conversely it can be used to spot
potential problem areas where the score is dropping.
The External Benchmark provides a comparison
of your organisation against similar organisations across the
country using:
·
Direct comparisons of your Rating or Agree % against the
appropriate national benchmark;
·
Which quartile your organisation falls into (A = area of strength,
D = area of concern).
The Benchmarks are created annually at the end
of the academic year. External Benchmarks are available for
your provider criteria, information supplied within your Coding
Frame and the Demographics section of your questionnaire. Given all
of this information we will produce External Benchmarks for:
·
Provider criteria:
o
Inspection Grade
o Provider
Size
o Provider
Type
o
Location
o Local
Authority
o
Geographical Region
o
Stakeholder Partnership
·
Subject criteria:
o Notional
Level
o
Attendance
o Subject
Sector Categories
o
Respondent demographics:
o
Attendance
o Age
o
Ethnicity
o Learner
Type
o Learning
Difficulty
o
Disability
A full description of the External
Benchmarking Report is available within the Understanding Reports
section. An External Benchmarking Report is produced for each area
of the school you targeted and for each demographic included within
the survey where QDP have sufficient information to give an
external comparison. The “All Respondents” slice provides an
overall comparison of the school against other primary schools and
can be used as a start point to identify your schools strengths and
weaknesses.
Filters are used to reduce still further the
data 'slice' being reported.
For example the report may be by a particular
course. This could be further filtered by Gender - Female if a
particular equality and diversity issue were being studied.
The filter can be any information supplied on
the coding frame or demographics featured within the
questionnaire.
The flattened total is used within the
calculation of the agree % and the rating.
It is the total number of respondents that
expressed an opinion. It excludes those who said the question was
not applicable or who gave no answer.
If this number is low in comparison to the
Respondents at the head of the report it indicates a low response
to the question. This can be caused by the question only being
asked to a limited number within the survey or the question being
poorly understood. In the latter case the wording of the question
may need to be altered.
Definition:
The count of all
those expressing an opinion. Normally the count of the Strongly
Agree, Agree, Disagree and Strongly Disagree.
Flattened Total =
(count of Strongly Agree) + (count of Agree) + (count of Disagree)
+ (count of Strongly Disagree)
A full description of the Graphical Report is
available within the Understanding Reports section. A graphical
report is produced for each area of the school you targeted and for
each demographic included within the survey. For example,
each school year or each class, gender or ethnicity.
Where a particular slice can be compared
externally there will be a matching External Benchmarking
Report. The difference is the comparator used to provide the
“Difference from”. In most circumstance the External
Benchmarking Report will provide the information required and if
used in conjunction with the appropriate Internal Benchmarking
report will give an External and Internal comparison.
Compares the chosen slice against other
respondents in the survey normally “All Respondents”. It
shows areas of comparative strength and weakness within the
school.
A full description of the Internal Benchmark
Report is available within the Understanding Reports section.
The report produces a side by side comparison of various slices of
the school against another slice, normally “All Respondents”.
The report is used to identify areas of comparative strength and
weakness within the school.
Within the League Table this shows the
mid-point or mean score for the chosen Report By sample.
Those above this point are better than
average, those below worse.
The figure shows the number of respondents who
either ticked Not Applicable or did not express an opinion by
ticking any other response.
If this is a high proportion of the
respondents it may be caused by:
·
a problem with the understanding of the question;
·
The question was only used in a single model in the survey project
which was targeted at low numbers compared to the overall
sample.
Indicates the number of Returns when expressed
as a percentage of the total number of returns.
Definition:
(Return / All
Respondents) * 100
Indicates the calendar dates used to select
the chosen benchmark. This is normally the previous one or two
academic years.
When you join QDP we will ask you to provide
details of your organisation. Examples are:
·
Inspection Grade
·
Provider Size
·
Provider Type
·
Location
·
Local Authority
·
Geographical Region
·
Stakeholder Partnership
This is the chosen Questionnaire Type used
within the All Returns.
However if different questionnaire models have
been used for different groups then one of the questionnaire can be
chosen.
The ranking is used to define the order of the
League Table Reports.
Thus if the report is by course and Ranked by
the questions asked within the Teaching & Learning section of
the questionnaire, the course scoring the highest on the
aggregation of all teaching and learning questions will be first
down to the lowest scoring course.
Rating is a weighted percentage with the value
of 0-100.
The rating provides a fair and honest
reflection of the target groups perception, as it is based on
accepting that 'Agree' is less than 'Strongly Agree'.
We have therefore devised a calculation that
takes this into consideration:
·
Each response of Strongly Agree scores a value of 1
·
Each response of Agree scores a value of 0.5
·
Each response of either Disagree or Strongly Disagree scores a
value of 0.
The total score for Strongly Agree and Agree
is then divided by the Flattened Total (i.e. all who answered
either, Strongly Agree, Agree, Strongly Disagree or Disagree) and
then multiply this by 100 to give a weighted percentage or 'The
Rating'
Working Example:
The following
answers are given for a question:
Strongly
Agree
10
Agree
6
Disagree
2
Disagree
Strongly 8
The Rating would be:
((10*1) + (6*0.5))
* 100 = 13 / 26 = 50
The Rating is:
·
A valid summary of each issue;
·
An equitable means of comparison, internally and externally;
·
A target for planning and forecasting;
·
A way of highlighting areas where learners only Agree to a
statement. This highlights issues that may soon become areas of
concern and should be addressed quickly.
The 'slice' of data covered by this
report.
For example a particular course, faculty or
site.
The slice may be further narrowed by the
filter information.
This is broken into a maximum of three
elements:
1.
The first element tells you the style of QDP report you are looking
at.
2.
The second element indicates the basis used for the figures within
the report. There are two report calculation methods:
a.
Rated - which uses a weighted percentage. This method is mainly
used for internal comparison. Ratings are easier to improve over
time than Agreement Percentages.
b.
Agreement Percentage - which simply totals the level of agreement.
This can used when providing information externally as it is more
easily understood without explanation. However to gain a measurable
improvement is much harder.
3.
On some report styles it is possible to order the statements on the
left hand side either into questionnaire order or in the order of a
framework. Examples of frameworks are Common Inspection Framework
(either English or Welsh), Every Child Matters or Investors in
People.
Shows the number of individual reply sheets
that have contributed to the survey. In other words, the number
contributors within the slice and with any filters applied.
Within a subject specific survey the number of
respondents is calculated using each survey for each
questionnaire.
Definition:
Total of all those
who answered one or more questions including those who replied Not
applicable.
The number of reply sheets received for a
particular cohort.
The return count is used within the
calculation of the agree % and the rating.
It is the total number of respondents that
expressed an opinion. It excludes those who said the question was
not applicable or who gave no answer.
If this number is low in comparison to the
Respondents at the head of the report it indicates a low response
to the question. This can be caused by the question only being
asked to a limited number within the survey or the question being
poorly understood. In the latter case the wording of the question
may need to be altered.
Definition:
The count of all
those expressing an opinion. Normally the count of the Strongly
Agree, Agree, Disagree and Strongly Disagree.
Return Count =
(count of Strongly Agree) + (count of Agree) + (count of Disagree)
+ (count of Strongly Disagree)
Summary Rating is a score with difference for
each section heading.
Indicates the number of respondents targeted
for a particular cohort.
This will not be accurate where a generic
feedback code is being used as, by its very nature, the targeted
number cannot be identified.
The number completing the survey expressed as
a percentage of the number targeted to complete the survey.
This can be used to target areas where poor
completion is being achieved. The yield will be shown in red when
it falls below the Low Yield Level shown at the top of the
report.
Definition:
(Return / Targeted) * 100
20 Data Sharing and
Processing Agreement
You the Customer is the Data
Controller and agrees to share the Personal Data with
The Data Processor, QDP Services Ltd (QDP), Windsor
House, Royal Court, Macclesfield SK11 7AE on terms set
out in this Agreement.
The Data Processor agrees
to use the Personal Data within the EEA on the terms set out in
this Agreement.
Agreed terms:
The
following definitions and rules of interpretation apply in this
agreement.
Definitions:
·
The Act: the Data Protection Act 1998, as amended from
time to time.
·
Agreed Purpose: has
the meaning given to it in clause 20.2 of this
Agreement.
·
The Agreement: this
Agreement.
·
Business Day: a day
other than a Saturday, Sunday, public holiday or QDP Christmas
closure day in England when banks in London are open for
business.
·
Data Protection
Authority: the relevant data protection authority
is The Information Commissioner, established under section 6 of the
Data Protection Act 1998.
·
Data Security
Breach: a breach of security leading to the
accidental or unlawful destruction, loss, alteration, unauthorised
disclosure of, or access to the Shared Personal Data.
·
The GDPR: theGeneral Data Protection Regulation (EU
2016/679) as amended from time to time.
·
The Parties: means QDP and
the Customer.
·
Privacy and Data Protection
Legislation: the Data Protection Act 1998, the
Data Protection Directive (95/46/EC), the Electronic
Communications Data Protection Directive (2002/58/EC), the
Privacy and Electronic Communications (EC Directive) Regulations
2003 (SI 2426/2003) (as amended), the Human Rights Act
1998, the European Convention on Human Rights, as from 25 May 2018
the General Data Protection Regulation (EU 2016/679) and all
applicable laws and regulations relating to the processing of the
personal data and privacy, including where applicable the guidance
and codes of practice issued by the Information Commissioner, and
the equivalent of any of the foregoing in any relevant
jurisdiction. References to legislation include any amendments made
to those laws from time to time.
·
The Personal Data:
the personal data and sensitive personal data detailed in clause
20.5 of this Agreement.
·
The Services: the services described in Schedule 1.
·
Term: The term of
this agreement will be the period covered by the Customer’s licence
to use QDP’s SurveyManager.
Data
Controller, Data Processor, Data Subject, Personal Data, Sensitive
Personal Data and Processing shall have the meanings given to them
in The Act and amended within The GDPR.
Clause,
schedule and paragraph headings shall not affect the interpretation
of this Agreement.
The
schedules form part of this Agreement and shall have effect as if
set out in full in the body of this Agreement. Any reference to
this Agreement includes the schedules.
Unless
the context otherwise, requires, words in the singular shall
include the plural and in the plural shall include the
singular.
A
reference to a statute or statutory provision shall include all
subordinate legislation made from time to time under that statute
or statutory provision.
References to clauses and Schedules are to the clauses and
Schedules of this agreement and references to paragraphs are to
paragraphs of the relevant Schedule.
Any words
following the terms including, include, in
particular or for example or any similar phrase shall be
construed as illustrative and shall not limit the generality of the
related general words.
In the
case of any ambiguity between any provision contained in the body
of this agreement and any provision contained in the Schedules or
appendices, the provision in the body of this agreement shall take
precedence.
A
reference to writing or written includes letter, fax
and email.
2.1 The
Parties acknowledge that the Customer is a Data Controller
and QDP is a Data Processor when processing personal data under the
terms of the Agreement. Each Party must ensure
compliance with the Privacy and Data Protection Legislation
at all times during the Term of the Agreement.
3.1 The Data
Processor agrees to process the Personal Data, as
described in clause 5, only for the purposes outlined in clause 4
of the Agreement and strictly for no other purpose without
the written authority of the Data Controller.
3.2 The Data
Processor will NOT disclose or share the Personal Data
processed under the Agreement, with any third party without
the written authority of the Data Controller.
3.3 The Data
Processor will not publish, copy, transfer or duplicate any
information without the written authority of the Data
Controller except as described in clause 5 of the
Agreement.
4.1 The
Agreement sets out the framework for the sharing of
Personal Data between the Data Controller. It sets
out the purposes for which the Personal data may be
processed by the Parties, the principles and procedures that
the Parties shall adhere to, and the responsibilities the
Parties owe to each other.
4.2 The
Parties consider this data sharing initiative necessary in
order for the Data Processor to deliver The Services.
Schedule 1 to the Agreement
provides a detailed outline of The Services and how the
personal data will be processed to deliver those services.
4.3 The Data
Processor agrees to only process the Personal
data in accordance with the Data Controller’s
instructions, and only for the purposes of providing The
Services as described in Schedule 1. The Parties shall
not process Personal Data in a way that is incompatible with
the purposes described in this clause (the Agreed
Purpose).
4.4 Each party
shall appoint a single point of contact (SPoC) who will work
together to reach an agreement with regards to any issues arising
from the data sharing and to actively improve the effectiveness of
the data sharing initiative.
5.1 The
Personal Data processed under the Agreement may comprise of one of
more of the following:
a)
Details used to target an individual who is going to complete a
survey. For example, name and unique user id.
b)
Details of an individual either provided in the targeting
information or gathered within the questionnaire which will be used
within the reporting. For example, age, gender, ethnicity, religion
and job role.
c)
Free text question answers where names have been mentioned by
respondents
5.2 The Volumes of
such data held for targeting and reporting purposes is at the
discretion of the Data Controller. The Personal Data
provided with the free text depends on the number of free text
questions asked and the number of times particular names are used.
QDP’s standard questionnaire will always ask the respondent not to
mention other individuals by name.
5.3 The
Parties agree that the Personal Data processed under the
Agreement must not be irrelevant or excessive with regard to
the Agreed Purposes set out in Clause 4.
6.1 Each
Party shall ensure that it processes the Personal
Data fairly and lawfully in accordance with thePrivacy and
Data Protection Legislation during the Term of
theAgreement. Further, the Data Controller shall
ensure that the processing satisfies an appropriate condition under
Schedule 2 and where relevant Schedule 3 of the Act and any
further consent required by the GDPR.
7.1 Data
Subjects have the rights in relation to their personal data
under the Privacy and Data Protection Legislation. Those
rights include:
d)
The right to be informed
e)
The right of access
f)
The right to rectification
g)
The right to erasure
h)
The right to restrict processing
i)
The right to data portability
j)
The right to object
k)
Rights in relation to automated decision making and profiling
7.2 To facilitate
the above rights, the Data Processor agrees to store or
record the Personal Data processed under the
Agreement in a structured, commonly used and machine readable
form.
7.3 The Data
Processor agrees to notify the Data Controller
immediately and no later than 48 hours upon receipt by the Data
Processor of a request from an individual seeking to exercise
any of their rights under the Privacy and Data Protection
Legislation, including those rights as described in clauses 7.1
above. The Data Processor agrees to notify the Data
Controller immediately and no later than 2 working days upon
receipt of any complaint from an individual regarding the
processing of Personal Data under the Agreement. The
Data Processor will provide the Data Controller with
full co-operation and assistance in relation to any such complaint
or request from an individual regarding the Processing of
Personal Data under this Agreement.
7.4 The Data
Processor agrees to act only under the Data Controller’s
instructions in relation to any activities undertaken to resolve
any complaints or comply with any requests from individuals under
clause 7.
7.5 The Data
Processor’s will maintain a record of requests or complaints
from data subjects seeking to exercise their rights under the
Privacy and Data Protection Legislation, including requests
for Personal Data processed under this Agreement. The
records described in this clause must include copies of the request
for information or complaint, details of the data accessed and
shared and where relevant, notes of any meeting, measures taken by
the Data Processor to resolve the complaint, correspondence
or phone calls relating to the request or complaint.
8.1 The
Data Processor shall retain and process the Personal
Data as described in Schedule 1.
8.2 On the
instructions of the Data Controller, the Data
Processor shall ensure that the Personal Data processed
under this Agreement are returned to the Data Controller or
destroyed in accordance with the Data Controller’s
instructions. The Data Controller has the right to issue
instructions to the Data Processor under this Clause at any
time. The Personal Data will be destroyed in the same manner as
described in Schedule 1.
8.3 Following the
deletion of Personal Data under clause 8.1 and 8.2, the
Data Processor will notify the Data Controller that
the Personal Data in question has been deleted.
9.1 The Data Processor shall not disclose
or transfer the Personal Data to a third party without the
prior written authorisation of the Data Controller. If the
Data Controller authorises the disclosure of the Personal
Data to a third party, the Data Processor agrees to
enter into an information sharing agreement with any relevant third
party which reflects the terms of the Agreement. The Data
Processor agrees to provide the Data Controller with
copies of any such information sharing agreement with a third
party. The Data Controller reserves the right of approval of
any such information sharing agreement and may request the Data
Processor to make any amendments deemed necessary to such an
agreement to ensure compliance with the Privacy and Data
Protection Legislation.
9.2 The
Data Processor will not disclose or transfer the Personal
Data to a third party located outside the EEA without the prior
written authorisation of the Data Controller.
10.1
The Data Processor agrees to
implement appropriate technological and organisational measures to
prevent:
a)
unauthorised or unlawful processing of the Personal
Data;
b)
the accidental loss or destruction of, or damage to, the
Personal Data
Ensure a level of security
appropriate to:
c)
the harm that might result from such unauthorised or unlawful
processing or accidental loss, destruction or damage;
d)
the nature of the Personal Data to be protected.
10.3 QDP has implemented the
following technological and organisational security measures:
a)
All data is held on secure servers within the United Kingdom which
are protected by appropriate firewalls;
b)
All passwords held are encrypted;
c)
All staff are fully aware of their responsibilities associated with
Privacy and Data Protection Legislation.
d)
All Personal Data will be removed when and as described in Schedule
1.
10.4 The Data Processor
agrees to notify the Data Controller of any material change
to the measures as described in Schedule 3.
10.4 It is the responsibility
of each Party to ensure that its staff members are
appropriately trained to handle and process the Personal Data in
accordance with the technical and organisational security measures
set out in Clause 10.3 together with any other applicable national
data protection laws and guidance.
11.1 The Data Processor
recognises that the Data Controller may be a public
authority for the purposes of the Freedom of Information Act 2000
and may be required to disclose information about the
Agreement, the services provided by the Data Processor
under the Agreement and the processing carried out under
the Agreement. The Data Processor agrees to provide
any reasonable assistance to the Data Controller as is
necessary to enable the Data Controller to comply with its
obligations under the Freedom of Information Act 2000.
12.1 The Data Processor
is under to a strict obligation to immediately notify the Data
Controller of any Data Security Breach and no later than
within one working day of the Data Processor becoming aware
of the breach.
12.2
The Data Processor agrees to
provide any reasonable assistance as is required by the Data
Controller or the Data Protection Authority to
facilitate the handling of any Data Security breach in an
expeditious and compliant manner.
13.1 In the event of a dispute
or claim brought by a Data Subject or the Data Protection
Authority concerning the processing of Personal Data
against either or both parties, the Parties will inform each other
about any such disputes or claims, and will cooperate with a view
to settling them amicably in a timely fashion.
a)
The Parties agree to respond to any generally available non-binding
mediation procedure initiated by a Data Subject or by the Data
Protection Authority. If they do participate in the proceedings,
the parties may elect to do so remotely (such as by telephone or
other electronic means). The Parties also agree to consider
participating in any other arbitration, mediation or other dispute
resolution proceedings developed for data protection disputes.
b)
Each Party shall abide by a decision of a competent court of the
Data Controller’s country of establishment or of the Data
Protection Authority in the Data Controller’s country of
establishment.
14.1 Except as expressly
provided in clause 7 (data subjects rights), a person who is not a
party to this Agreement shall not have any rights under the
Contracts (Rights of Third Parties) Act 1999 to enforce any term of
this Agreement.
15.1 If any provision or
part-provision of the Agreement is or becomes invalid,
illegal or unenforceable, it shall be deemed modified to the
minimum extent necessary to make it valid, legal and enforceable.
If such modification is not possible, the relevant provision or
part-provision shall be deemed deleted. Any modification to or
deletion of a provision or part-provision under this clause shall
not affect the validity and enforceability of the rest of this
agreement.
15.2 If either Party
gives notice that any provision or part-provision of this agreement
is invalid, illegal or unenforceable, the Parties shall
negotiate in good faith to amend such provision so that, as
amended, it is legal, valid and enforceable, and, to the greatest
extent possible, achieves the intended commercial result of the
original provision.
16.1 In case the applicable
data protection and ancillary laws change in a way that the
Agreement is no longer adequate for the purpose of governing lawful
data sharing exercises, the Data Controller reserves the right to
amend the Agreement. In such circumstances, the Data
Processor agrees to use its best endeavours to implement any
changes to its processing activities as are necessary to comply
with the amended terms of the Agreement.
17.1 Nothing in the
Agreement is intended to, or shall be deemed to, establish any
partnership or joint venture between any of the parties, constitute
any party the agent of another party, or authorise any party to
make or enter into any commitments for or on behalf of any other
party.
18.1 The Agreement
constitutes the entire agreement between the Parties and
supersedes and extinguishes all previous agreements, promises,
assurances, warranties, representations and understandings between
them, whether written or oral, relating to its subject matter.
a)
Each Party acknowledges that in entering into the Agreement
it does not rely on, and shall have no remedies in respect of any
statement, representation, assurance or warranty (whether made
innocently or negligently) that is not set out in the
Agreement.
b)
Each Party agrees that it shall have no claim for innocent or
negligent misrepresentation or negligent misrepresentation based on
any statement in the Agreement.
19.1 The rights and remedies
provided under the Agreement are in addition to, and not
exclusive of, any rights or remedies provided by law.
20.1 Any notice or other
communication given to a Party under or in connection with
this Agreement shall be in writing and shall be:
a)
delivered by hand or by pre-paid first-class post or other next
working day delivery service at its registered office (if a
company) or its principal place of business (in any other case);
or
b)
sent by email.
20.2 Any notice or
communication shall be deemed to have been received:
a)
if delivered by hand, on signature of a delivery receipt or at the
time the notice is left at the proper address;
b)
if sent by pre-paid first-class post or other next working day
delivery service, at 9.00 am on the second Business Day after
posting or at the time recorded by the delivery service;
c)
if sent by fax or email, at 9.00 am on the next Business Day after
transmission.
20.3
This clause does not apply to the
service of any proceedings or other documents in any legal action
or, where applicable, any arbitration or other method of dispute
resolution
21.1 This Agreement and any
dispute or claim (including non-contractual disputes or claims)
arising out of or in connection with it or its subject matter or
formation shall be governed by and construed in accordance with the
law of England and Wales.
21.2 This agreement has been
entered into on the date stated at the beginning of it.
21 Schedule 1 – The
Services
1.
The Personal Data held is described in Clause 5 above.
2.
The Data Deletion Date will be between 2 months and 3 months
after the last set of reports have been run or the survey has been
deleted whichever is the sooner.
3.
When transferring data containing Personal Data, for example
target lists, it will be password protected and the password will
be shared via a different communication method. For example a
target lists may be emailed and the password shared by phone.
4.
Within questionnaires where names are mentioned it is the
responsibility of the Data Controller to ensure they are
blocked out once the survey has been completed. Where names are
included by means of merge fields from the target list these will
be overwritten as described by the Data Processor on the
appropriate Data Deletion Date.
5.
Where a target list contains identifying Personal Data, for
example name or unique student Id, these will be overwritten with
the word Removed on the Data Deletion Date.
6.
All free text question text will be removed on the Data Deletion
Date.
7.
It is the Data Controllers responsibility to ensure all
reports produced comply with the Privacy and Data Protection
Legislation.
8.
When producing reports the data is transferred from the
SurveyManager secure server to our own, office based secure server.
This copy and a copy of the reports produced will dealt with in the
same way as the SurveyManager copy.
9.
When additional services are requested by SurveyManager Customers,
for example checking comments or printing questionnaires, the
Services are described in the section below.
10.
If paper questionnaires are processes by QDP they may contain
references to names and should therefore be securely wrapped when
returned by courier or post and QDP should notify of despatch to
ensure we can notify the Customer if any go astray.
11.
When processing paper questionnaires QDP scan them and hold an
image of the paper and snippet images of the comments on their
office secure server. These will be removed on the Data Deletion
Date.
12.
When QDP type paper comments the snippet image of the comment is
transferred between the office secure server and an external secure
server where they are processed by being viewed and typed over the
internet. This copy will be removed on the Data Deletion
Date.
13.
Where QDP are asked to check comments gathered online these are
transferred and processed as above.
14.
All free text question text will be removed on the Data Deletion
Date.
Please read these Terms of Use
carefully. They govern your use of QDP’s Survey Manager and your
relationship with QDP Services Limited (“QDP”) whose offices are at
Suite 1 Bailey Court, Green Street, Macclesfield SK10 1JQ.
Set out below are the terms and conditions under which QDP makes
available its web based questionnaire management tool – QDP’s
Survey Manager to each person or entity (each a
"Customer").
These Terms of Use, together with any
and all other terms, rules or procedures published on QDP’s Survey
Manager from time to time and related to Customer's use of QDP’s
Survey Manager (together, this "Agreement"), each as updated
from time to time by QDP, constitute a binding, legal agreement
between QDP and Customer.
By using QDP’s Survey Manager you agree
to, and are bound by, this Agreement. If you do not agree with any
of the terms of this Agreement, do not access or use QDP’s Survey
Manager or any information contained within it.
QDP may make changes to the materials
and services offered within QDP’s Survey Manager at any time. QDP
can change the terms of this Agreement at any time. If QDP changes
the terms of this Agreement, QDP will post an updated set of Terms
of Use on QDP’s Survey Manager and will send registered Customers
an email notice of the changes in advance of implementing
them.
If any modification is unacceptable to
you, you shall cease using QDP’s Survey Manager and be able to
terminate your Licence. If you do not cease using QDP’s Survey
Manager, you will be deemed to have accepted the change.
Each Customer hereby warrants that if
it is a corporation or other legal entity, Customer is validly
formed and existing under the laws of its jurisdiction and has duly
authorized its agent or agents to enter into this Agreement and, if
an individual, Customer is of the age of majority in his or her
place of residence.
2.1. If Customer purchases a Licence or is granted a
free Licence to use QDP’s Survey Manager (“Licence”), Customer
shall pay all fees, as applicable, to QDP as well as VAT and any
other applicable taxes, as published in QDP Price Guide and
available on QDP’s Survey Manager. QDP may change such fees at any
time and at its sole discretion, provided that any such change
shall become effective at the end of the current term of Customer's
Licence. QDP will provide Customer with at least 60 days prior
notice of any change in fees to allow Customer to cancel their
Licence prior to the end of the current term.
2.2. By granting of a Licence QDP will
create an account (“Account”) on QDP’s Survey Manager for use by
Customer. Each account allows unlimited usage of QDP’s Survey
Manager for the licence period agreed and/or charged.
2.3. The Licence is on a continuous
service basis. This means that, subject to the terms and conditions
of this Agreement, QDP shall automatically renew Customer's Licence
at the end of its term unless Customer's Licence is cancelled by
giving 30 days’ notice in writing, by email or by using the Contact
Us page within QDP’s Survey Manager or on any of QDP’s web sites.
Customer will be charged a renewal rate equal to the rate for the
immediately preceding Licence, unless QDP has notified Customer of
any new rate in advance. A
cancellation of a Licence requested by Customer will become
effective on the date that the current Licence period
expires.
If Customer
purchases additional services, for example printing of
questionnaires or undertaking of phone calls by QDP (“Additions”),
Customer shall pay for these Additions as well as VAT and any other
applicable taxes, as published in QDP Price Guide and available on
QDP’s Survey Manager and as agreed with QDP at the time of
purchase.
Certain content and information
provided as part of QDP’s Survey Manager, including, without
limitation, documents, graphics and images that are not Customer
Content (as defined below) (collectively, the "QDP Materials") are
provided to you by QDP and are the copyrighted and/or trademarked
work of QDP or QDP's contributors. QDP grants you a limited,
personal, non-exclusive and non-transferable license to use and to
display the QDP Materials solely for your personal use in
connection with QDP’s Survey Manager.
Except as expressly permitted in this
Agreement, you have no right to modify, edit, copy, reproduce,
create derivative works of, reverse engineer, alter, enhance or in
any way exploit any of the QDP Materials in any manner. This
Licence terminates automatically, without prior notice to you, if
you breach any term of this Agreement. Except for the limited
rights granted by this Agreement, you acknowledge that you have no
right, title or interest in or to any QDP Materials.
5.1. Customer acknowledges and agrees that:
(a) all survey questions, information, data, text,
software, music, sound, photographs, images, video, survey
responses, messages or other materials communicated, submitted or
transmitted by Customer or respondents of Customer's surveys
through QDP’s Survey Manager (collectively, "Customer Content"),
whether publicly posted or privately transmitted, are the sole
responsibility of the person from whom such Customer Content
originated,
(b) Customer, and not QDP, is responsible for all
Customer Content that Customer or respondents of Customer's surveys
upload, post, email, distribute, communicate, or otherwise make
available using QDP’s Survey Manager or that is otherwise made
available through the use of Customer's Licence, whether or not
authorized by Customer,
(c) by using QDP’s Survey Manager, Customer may be
exposed to Customer Content that is unlawful, harmful, threatening,
abusive, harassing, tortious, defamatory, libellous, vulgar,
obscene, offensive, indecent, invasive of another's privacy,
hateful, or racially, ethnically or otherwise objectionable,
and
(d) by communicating or transmitting any Customer
Content using QDP’s Survey Manager, Customer grants to QDP an
irrevocable, non-exclusive, royalty-free and worldwide license to
use such Customer Content for the purpose of operating QDP’s Survey
Manager, and Customer warrants to QDP that it has the right to
grant such license for such purposes.
5.2. Customer further acknowledges and agrees that QDP
does not control the Customer Content originating from Customer,
respondents to Customer's surveys or other Customers of QDP, and
does not guarantee the accuracy, integrity or quality of such
Customer Content. Notwithstanding the foregoing, QDP may, but is
not obligated to, review all Customer Content and block, modify,
terminate access to, or remove any such Customer Content that QDP,
in its sole discretion, considers being non-compliant with any of
the requirements of this Agreement.
5.3. QDP reserves the right to purge Customer Content over 5
years old from its databases at any time and from time to time
without notice. Where a Customer terminates their use of QDP’s
Survey Manager QDP will retain Customer Content for a minimum
period of 1 year before deletion. QDP shall not be liable for any
purging, deletion or failure to retain any such Customer
Content.
5.4. QDP may disable Customer's Account and Customer's
access to QDP’s Survey Manager and QDP may recover from Customer
any losses, damages, costs or expenses incurred by QDP resulting
from or arising out of Customer's non-compliance with any provision
of this Agreement.
5.5. Customer may use and modify all template content
(“Templates”) provide as part of QDP’s Survey Manager. QDP do not
warrant the accuracy or applicability of any of Templates and once
used forms part of Customer Content.
In connection with Customer's use of
QDP’s Survey Manager, and without limiting any of Customer's other
obligations under this Agreement or applicable law,
Customer:
(a) shall comply with all local and international laws
and other rules, regulations, policy and procedures applicable to
Customer relating to unsolicited commercial email messages,
defamation, privacy, obscenity, intellectual property, data
protection, privacy, or child protective email address registries,
to which Customer may be bound that are related to Customer's use
of QDP’s Survey Manager;
(b) shall not upload, post, email, distribute,
communicate, transmit or otherwise make available any Customer
Content: (i) that is unlawful, harmful, threatening, abusive,
harassing, tortious, defamatory, libellous, vulgar, obscene,
offensive, indecent, invasive of another's privacy, hateful, or
racially, ethnically or otherwise objectionable, (ii) that
infringes any patent, trademark, trade secret, copyright, or other
intellectual property right of any party, (iii) that Customer does
not have the right to make available by reason of any law or any
other relationship, or (iv) that comprises or includes any "junk
mail", "spam", "chain letters", "pyramid schemes", or any similar
form of solicitation;
(c) shall not use QDP’s Survey Manager to send surveys,
polls, or other materials to individuals under the age of majority
in his or her place of residence ("Minors") unless Customer is
permitted to do so under all applicable laws, or to harm minors in
any way, and shall not send surveys, polls, or other materials to
Minors that would subject QDP to any local or international law,
rule or regulation governing children's privacy, rights of
personality or otherwise related to protecting minors;
(d) shall not impersonate any other person or entity,
including QDP, or a QDP official;
(e) shall, if Customer uses the Services to send a
survey using email, not mislead the recipients of that survey that
Customer may have the ability to associate individual responses to
that survey with the individual email addresses to which that
survey was sent by stating that Customer has no such ability. QDP
recommends that such Customers' surveys include the following
notice:
"Please be advised that your responses
to this survey may not be treated as anonymous by the survey
sender."
(f) shall not interfere with or disrupt QDP’s Survey
Manager or servers or networks connected to QDP’s Survey Manager,
or disobey any requirements, procedures, policies, or regulations
of networks connected to QDP’s Survey Manager;
(g) shall not engage in excessive usage of QDP’s Survey
Manager, as determined by QDP in its sole discretion, including
usage that adversely affects the speed, responsiveness, or
functionality of the QDP’s Survey Manager, or disrupts the
availability of the QDP’s Survey Manager for other
Customers;
(h) shall not attempt to damage, deny service to, hack,
crack, reverse engineer, or otherwise interfere with QDP’s Survey
Manager in any manner;
(i) shall not upload, post, email, distribute,
communicate, transmit, or otherwise make available any viruses or
similar malicious software that may damage the operation of a
computer, or QDP’s Survey Manager; and
(j) shall not upload survey links to message boards or
newsgroups that are not relevant to the subject matter of the
survey, or that prohibit such uploading without QDP's prior written
consent.
Customer further acknowledges and
agrees that QDP may cooperate with any governmental authority in
connection with any investigation into Customer's use of QDP’s
Survey Manager, including use in contravention of applicable laws,
and may, in accordance with applicable laws, disclose any Customer
Content, and any other information pertaining to the Customer or to
Customer's use of QDP’s Survey Manager, to such governmental
authority in connection with any such investigation.
Customer shall indemnify, defend and
hold harmless QDP, its affiliates, and their respective directors,
officers, employees, servants and agents from and against all
claims, demands, damages, liabilities and costs (including legal
fees on a full indemnity basis) arising out of or in connection
with:
(a) Customer's use of QDP’s Survey Manager, including
Customer's use of or reliance on any information or materials
(including survey or poll results or responses) obtained through
the use of QDP’s Survey Manager,
(b) any other use of the Services by a third party
using Customer's Account (whether or not authorised by
Customer),
(c) Customer's breach of this Agreement, including any
of Customer's representations and warranties under this Agreement,
or
(d) Customer's contravention of any law applicable to
Customer.
8.1. This Agreement shall automatically become effective
upon Customer's first use of QDP’s Survey Manager, and continue
indefinitely until it is terminated.
8.2 With respect to Customers in the United Kingdom who are
dealing as consumers (as defined by the U.K. Electronic Commerce
Regulations 2002 and the Consumer Protection (Distance Selling)
Regulations 2000) ("U.K. Consumers"), U.K. Consumers shall have the
right to cancel this Agreement within seven (7) working days from
the date of the day following the day the U.K. Consumer has entered
into this Agreement by providing written notice of cancellation to
QDP.
8.3. QDP may cancel Customer's Account (if Customer has
one) and automatically terminate this Agreement immediately by
notice to Customer in the event that Customer breaches any of
Customer's representations, warranties, or obligations under this
Agreement (including any of Customer's obligations under Section
5 (Customer Content)) or contravenes any applicable
law.
8.4. Customer may cancel Customer's Account (if Customer
has one) and terminate this Agreement by written notice to QDP in
the event that QDP materially breaches any of its obligations under
this Agreement, if such breach is not cured within sixty days of
QDP's receipt of notice of breach from such Customer.
8.5. Upon termination of this Agreement for any reason,
Customer shall immediately cease all use of QDP’s Survey Manager,
and Customer acknowledges and agrees that QDP may, in its sole
discretion, take any measures QDP reasonably deems necessary or
desirable to prevent further use by Customer of QDP’s Survey
Manager, including by blocking Customer's IP address. Customer
further acknowledges and agrees that upon termination of this
Agreement, QDP shall not be obliged to retain any Customer Content
(including survey or poll results or responses) or to provide the
same to Customer, but may elect to do so in its sole
discretion.
8.6. Termination of this Agreement for breach as defined
in Section 8.3 (Termination) above shall not entitle
Customer to a refund of any unearned Licence fees previously paid
by Customer.
The following will survive this
agreement:
(a) all of Customer's representations, warranties and
indemnities given under this Agreement;
(b) all disclaimers of warranties, and limitations and
exclusions of liability; and
(c) the last sentence of Section 4 (QDP
Materials), and each of Sections 5 (Customer Content),
7 (Indemnity by Customer), 8.4 (Termination),
8.5 (Termination), 8.6 (Termination), 10
(Limitations and Exclusions of QDP's Liability), 11
(Intellectual Property Rights), and 13 (General).
9.1. QDP reserves the right at any time and from time to
time to modify, suspend, or discontinue, temporarily or
permanently, QDP’s Survey Manager or any part thereof, or
Customer's access thereto, and to modify, suspend or delete QDP’s
Survey Manager or any part thereof, and QDP will use commercially
reasonable efforts to provide reasonable advance notice of changes
that significantly impact QDP’s Survey Manager in a negative
manner. In the case of changes that significantly impact QDP’s
Survey Manager in a negative manner, Customer is entitled to cancel
Customer's Licence, if any. Customer acknowledges and agrees that
QDP shall not be liable to Customer, or to any third party, for any
modification, suspension or discontinuance of the Services or any
modification, suspension or deletion of the Site.
9.2. Without limiting Section 9.1 (Provision of
QDP’s Survey Manager), if Customer engages in excessive usage of
QDP’s Survey Manager (as described in Section 6(g) (Customer
Conduct)), QDP may take such action as it considers necessary to
prevent such excessive usage and to restore the availability of
QDP’s Survey Manager to other Customers, including by limiting or
suspending Customer's access to QDP’s Survey Manager, or by
cancelling Customer's Licence and terminating this
Agreement.
9.3. Customer acknowledges and agrees that QDP’s Survey
Manager is provided "as is" and "with all faults," and that, QDP
has no responsibility or liability for the loss or deletion of, or
failure to receive, process, or store any Customer Content
(including survey or poll results or responses) maintained or
transmitted using QDP’s Survey Manager.
9.4. Customer acknowledges and agrees that the
information, software, products, and services contained in or
available through QDP’s Survey Manager, including information,
software, products and services made available by other Customers
of QDP’s Survey Manager, may include inaccuracies or
errors.
9.5. Customer further acknowledges and agrees that
Customer, and not QDP, is responsible for evaluating the accuracy,
reliability, completeness, and usefulness of any information
obtained through the use of QDP’s Survey Manager.
9.6. QDP makes no representations or warranties
regarding the suitability, reliability, availability, timeliness,
quality, or lack of viruses, or other harmful components of QDP’s
survey manager, or the accuracy of such information, software,
products and services.
9.7. To the fullest extent permitted by applicable law,
QDP, its affiliates, and their respective directors, officers,
employees, servants and agents hereby disclaim all warranties,
express or implied, with regard to such information, software,
products or services, including any warranty of non-infringement of
third party rights, and the implied warranties of merchantability
and fitness for purpose.
10.1. In no event shall QDP, its affiliates, or their
respective directors, officers, employees, servants or agents be
liable for any direct, indirect, punitive, incidental, special or
consequential damages whatsoever, including damages for lost
profits, lost revenue, loss of use or data, or costs of cover,
arising out of or in any way connected with this agreement, whether
based on contract, tort, strict liability or any other legal
theory, even if QDP has been advised of the possibility of such
damages, including damages arising out of:
(a) the use or performance of, the delay in providing,
the failure to provide, or the inability to use, QDP’s Survey
Manager, or
(b) any information, software, products or services
contained in or available through QDP’s Survey Manager, including
information, software, products and services made available by
other customers of QDP’s Survey Manager.
Customer specifically agrees that QDP,
its affiliates, and their respective directors, officers,
employees, servants and agents shall not be liable for:
(c) unauthorized access to or alteration of any
transmissions or data, any material or data sent or received or not
sent or not received, or any transactions entered into through
QDP’s Survey Manager or in reliance upon any information obtained
through the use of QDP’s Survey Manager,
(d) any threatening, defamatory, obscene, offensive or
illegal content or conduct of any other party or any infringement
of a third party's rights, including intellectual property rights,
or
(e) any content sent using, or included in, QDP’s
Survey Manager by any third party.
If customer is dissatisfied with any
portion of QDP’s Survey Manager, customer's sole and exclusive
remedy is to terminate this agreement and discontinue using QDP’s
Survey Manager.
10.2. In the event that, notwithstanding the foregoing
exclusions of liability, QDP, any of its affiliates, or any of
their respective directors, officers, employees, servants or agents
is liable to customer for any amounts under this agreement under
any theory of recovery, whether based on contract, tort, strict
liability or otherwise, QDP's (or such affiliates', director's,
officer's, employee's, servant's or agent's, as applicable) total
liability in respect of such amounts shall not exceed the greater
of:
(a) the amount of one hundred pounds sterling
(£100.00), and
(b) the amounts actually received by QDP from customer
under this agreement within the previous 12 months.
10.3. Nothing in sections 10.1 and 10.2 of the
agreement shall limit QDP's or its affiliates' or their respective
directors', officers', employees', servants', or agents' liability
for: (a) death or personal injury caused by negligence (as such
term is defined in the unfair contract terms act 1977); (b) fraud;
(c) misrepresentation as to a fundamental matter; or (d) any
liability which cannot be excluded or limited under applicable
law.
10.4. Customer acknowledges and agrees that without the
foregoing exclusions and limitations of liability, QDP would not be
able to offer QDP’s Survey Manager, and that such exclusions and
limitations of liability shall apply, even if they would cause
customer's remedies under this agreement to fail of their essential
purpose.
QDP’s Survey Manager and all
information and screens appearing on QDP’s Survey Manager,
including documents, services, site design, text, graphics, logos,
images and icons, as well as the arrangement thereof, are the sole
property of QDP Services Limited, its affiliates, or its third
party licensors. Except as otherwise required or limited by
applicable law, any reproduction, distribution, modification,
retransmission, or publication of any copyrighted material is
strictly prohibited without the express written consent of the
copyright owner or license. QDP reserves all rights in QDP’s Survey
Manager that are not expressly granted. Nothing in this Agreement
shall be deemed to assign or transfer to Customer any rights to any
such intellectual property. Customer further acknowledges and
agrees that QDP Materials and other content made available to
Customer through the Services may be subject to the intellectual
property rights of third parties.
Your use of this Site is governed by the QDP privacy policy. You
agree that you are responsible for notifying the respondents of
surveys that you create through QDP’s Survey Manager about how QDP
may use the respondents' survey responses as described in the
Privacy Policy.
13.1. QDP may provide references, frames or hyperlinks to
internet websites maintained by third parties. QDP does not warrant
that it has reviewed such third party websites and makes no claims,
representations or warranties regarding such third party websites
or the contents of the same. QDP is not responsible for, nor does
it endorse or recommend, any products or services provided by such
third parties through such third party websites or by any other
means.
13.2. Customer acknowledges and agrees that Customer, and
not QDP, is responsible for determining which laws may apply to
Customer's use of QDP’s Survey Manager and assessing Customer's
obligations under such laws.
13.3. QDP is registered with the Information Commissioner
for marker research purposes. Registration number
Z9243582.
13.4. All notices and other communications required or
permitted to be given by QDP to Customer under this Agreement will
be deemed to be properly given on the date when:
a)
posted on QDP’s Survey
Manager,
b)
sent by email to the email address for
Customer last recorded by QDP, or
c)
sent by postal mail to the postal
address for Customer last recorded by QDP.
Customer may give notices to QDP under
this Agreement by email to support@qdpservices.co.uk
13.5. This Agreement comprises the entire agreement
between QDP and the Customer relating to QDP’s Survey Manager. Both
Customer and QDP confirm that they have not relied upon, and shall
have no remedy in respect of, any agreement, warranty, statement,
representation, understanding or undertaking made by any party
(whether or not a party to this Agreement) unless that agreement,
warranty, statement, representation, understanding or undertaking
is expressly set out in this Agreement.
13.6. The use of the terms "includes" and "including",
and similar terms, shall be deemed not to limit what else might be
included.
13.7. This Agreement shall be governed by the laws of
England. Customer may not assign this Agreement without QDP's prior
written consent, which may be withheld in QDP's sole
discretion.
13.8. QDP may assign this Agreement at any time to the
successor in interest in connection with a merger, consolidation or
other corporate reorganization in which QDP participates or to the
purchaser of all or substantially all of QDP's assets to which
QDP’s Survey Manager relates.
13.9. In any dispute arising out of this Agreement, the
substantially prevailing party shall be entitled to payment of its
reasonable legal fees and costs.
QDP IS THE PUBLISHER OF QDP’S SURVEY
MANAGER. THE HOST OF QDP’S SURVEY MANAGER IS RACKSPACE.